Feature-gruppe · Se tendenser
Opdag engagement-skift før de bliver til problemer
Enkelte datapunkter fortæller jer hvor I er, men tendenserne fortæller jer hvor I er på vej hen. Uden at følge engagement over tid kan I ikke vurdere, om problemer bliver bedre eller værre, om jeres initiativer reelt virker, eller fange et skred i trivslen, før det bliver en krise.
Det får I
7 features der gør gruppen til virkelighed.
01
Opdag engagement-skift før de bliver til problemer
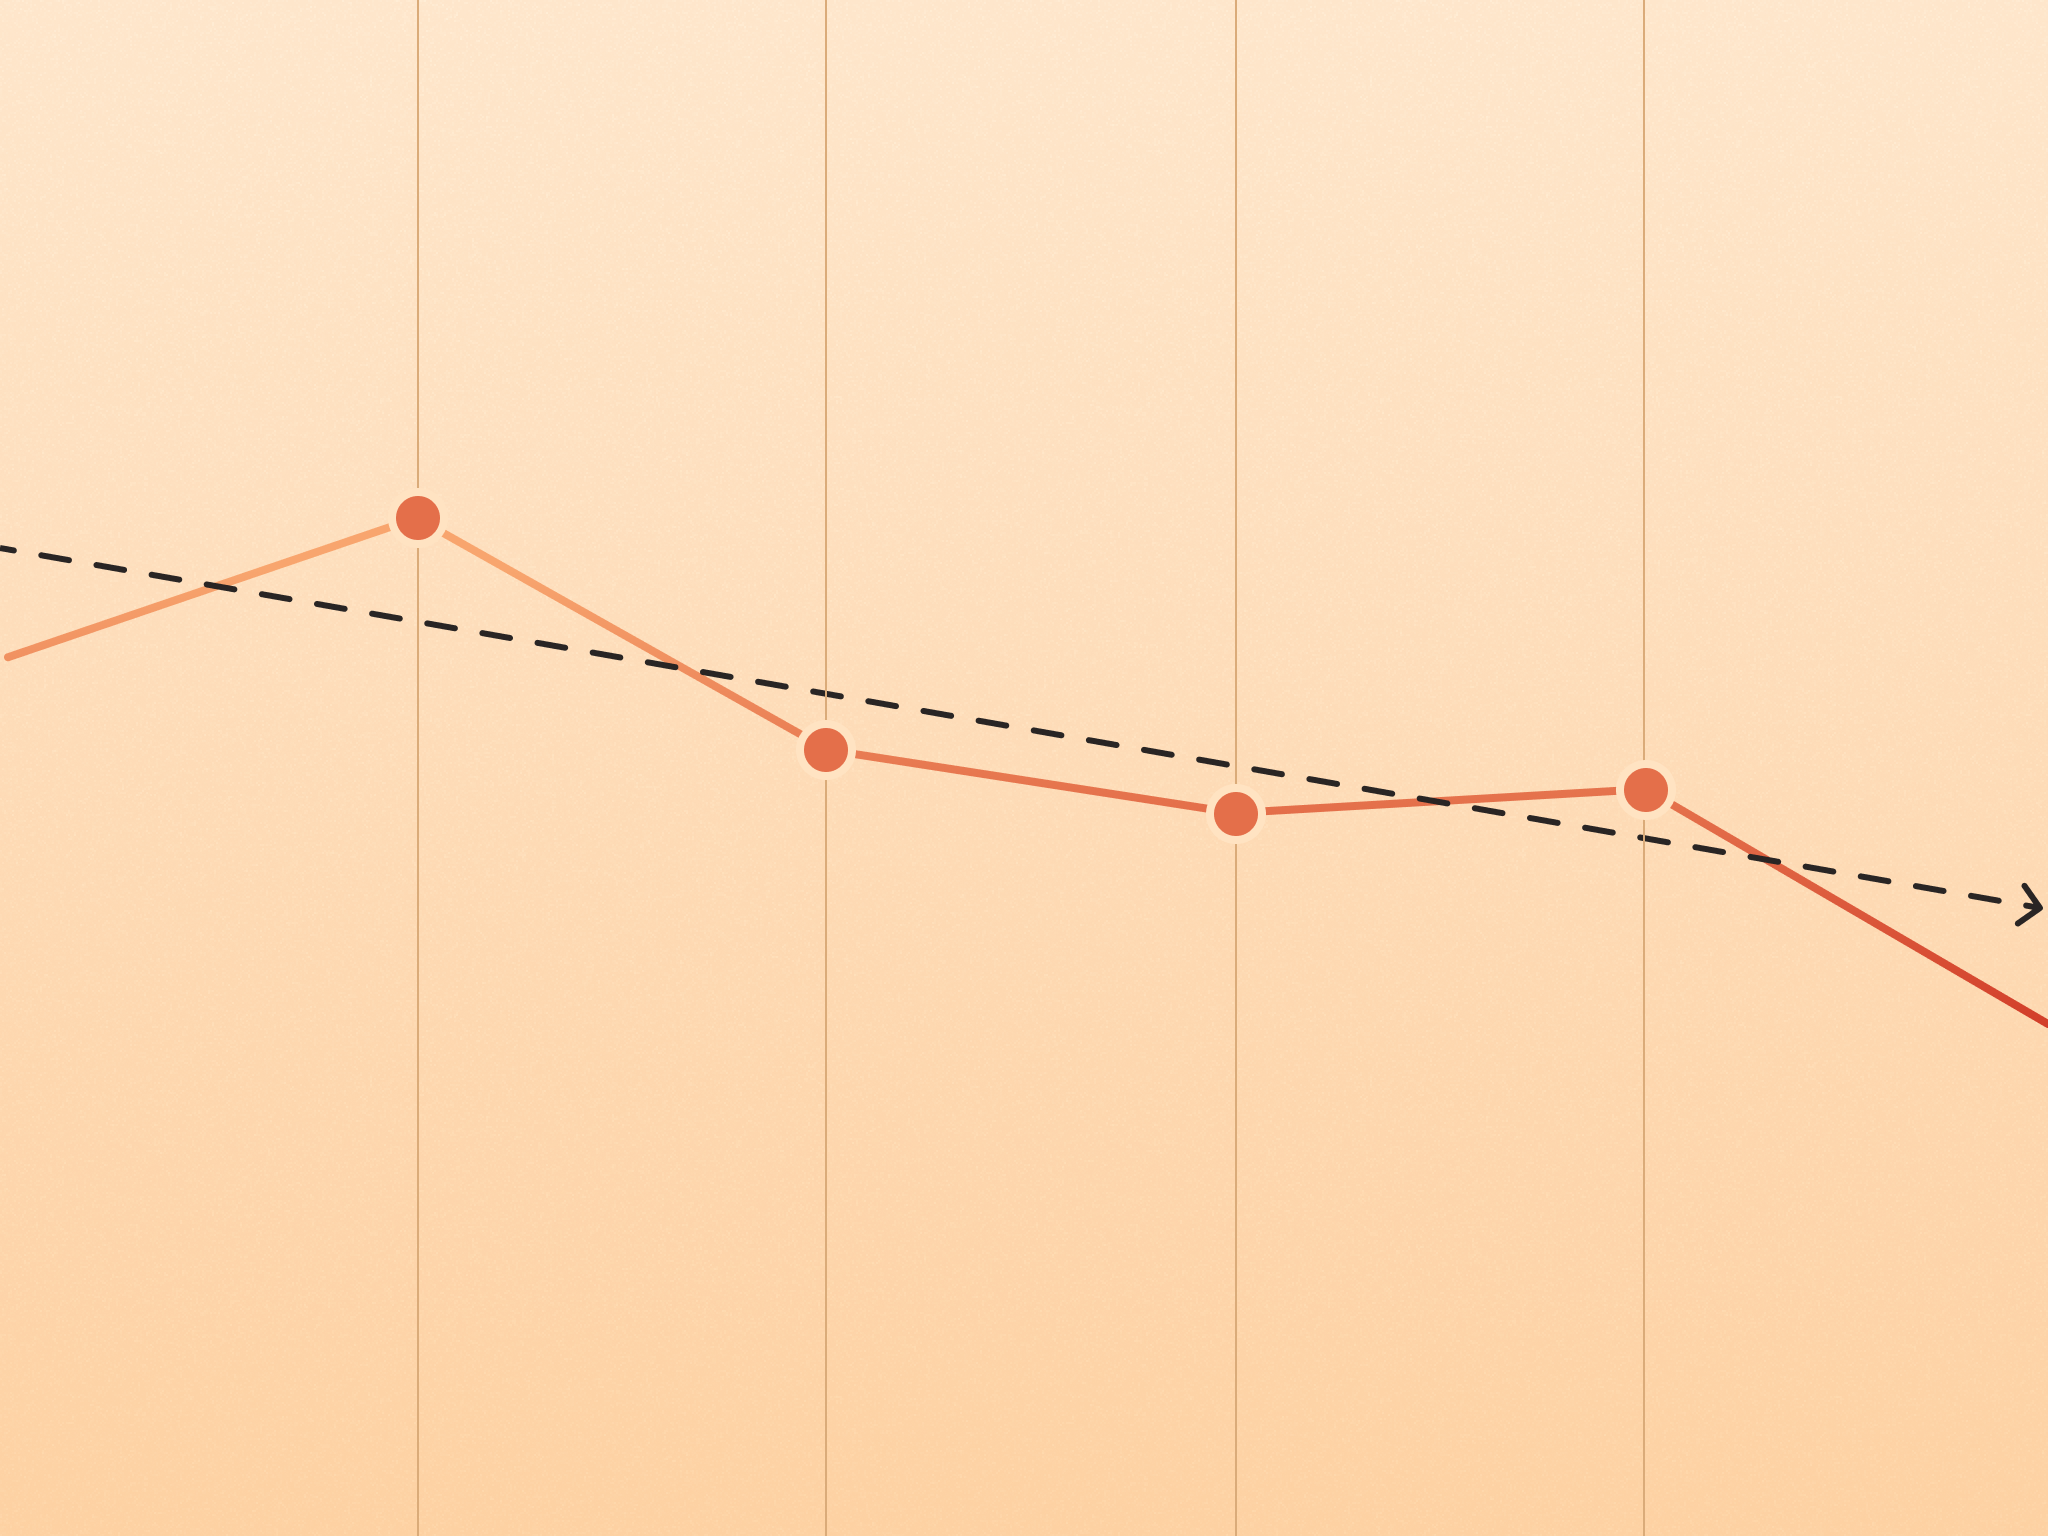
Zoios følger engagement-tal over tid og fremhæver væsentlige trends i virksomhedens eller teamets scores, så I tidligt får øje på trivsel der skrider. Platformen viser, om scores forbedres, falder eller holder sig stabile, med visuelle indikatorer der trækker opmærksomheden mod betydningsfulde ændringer. Ved at hente trendene frem automatisk kan I være proaktive om engagement-problemer i stedet for reaktive og gribe ind, når scoren begynder at slippe, i stedet for at vente til I står med et reelt problem.
02
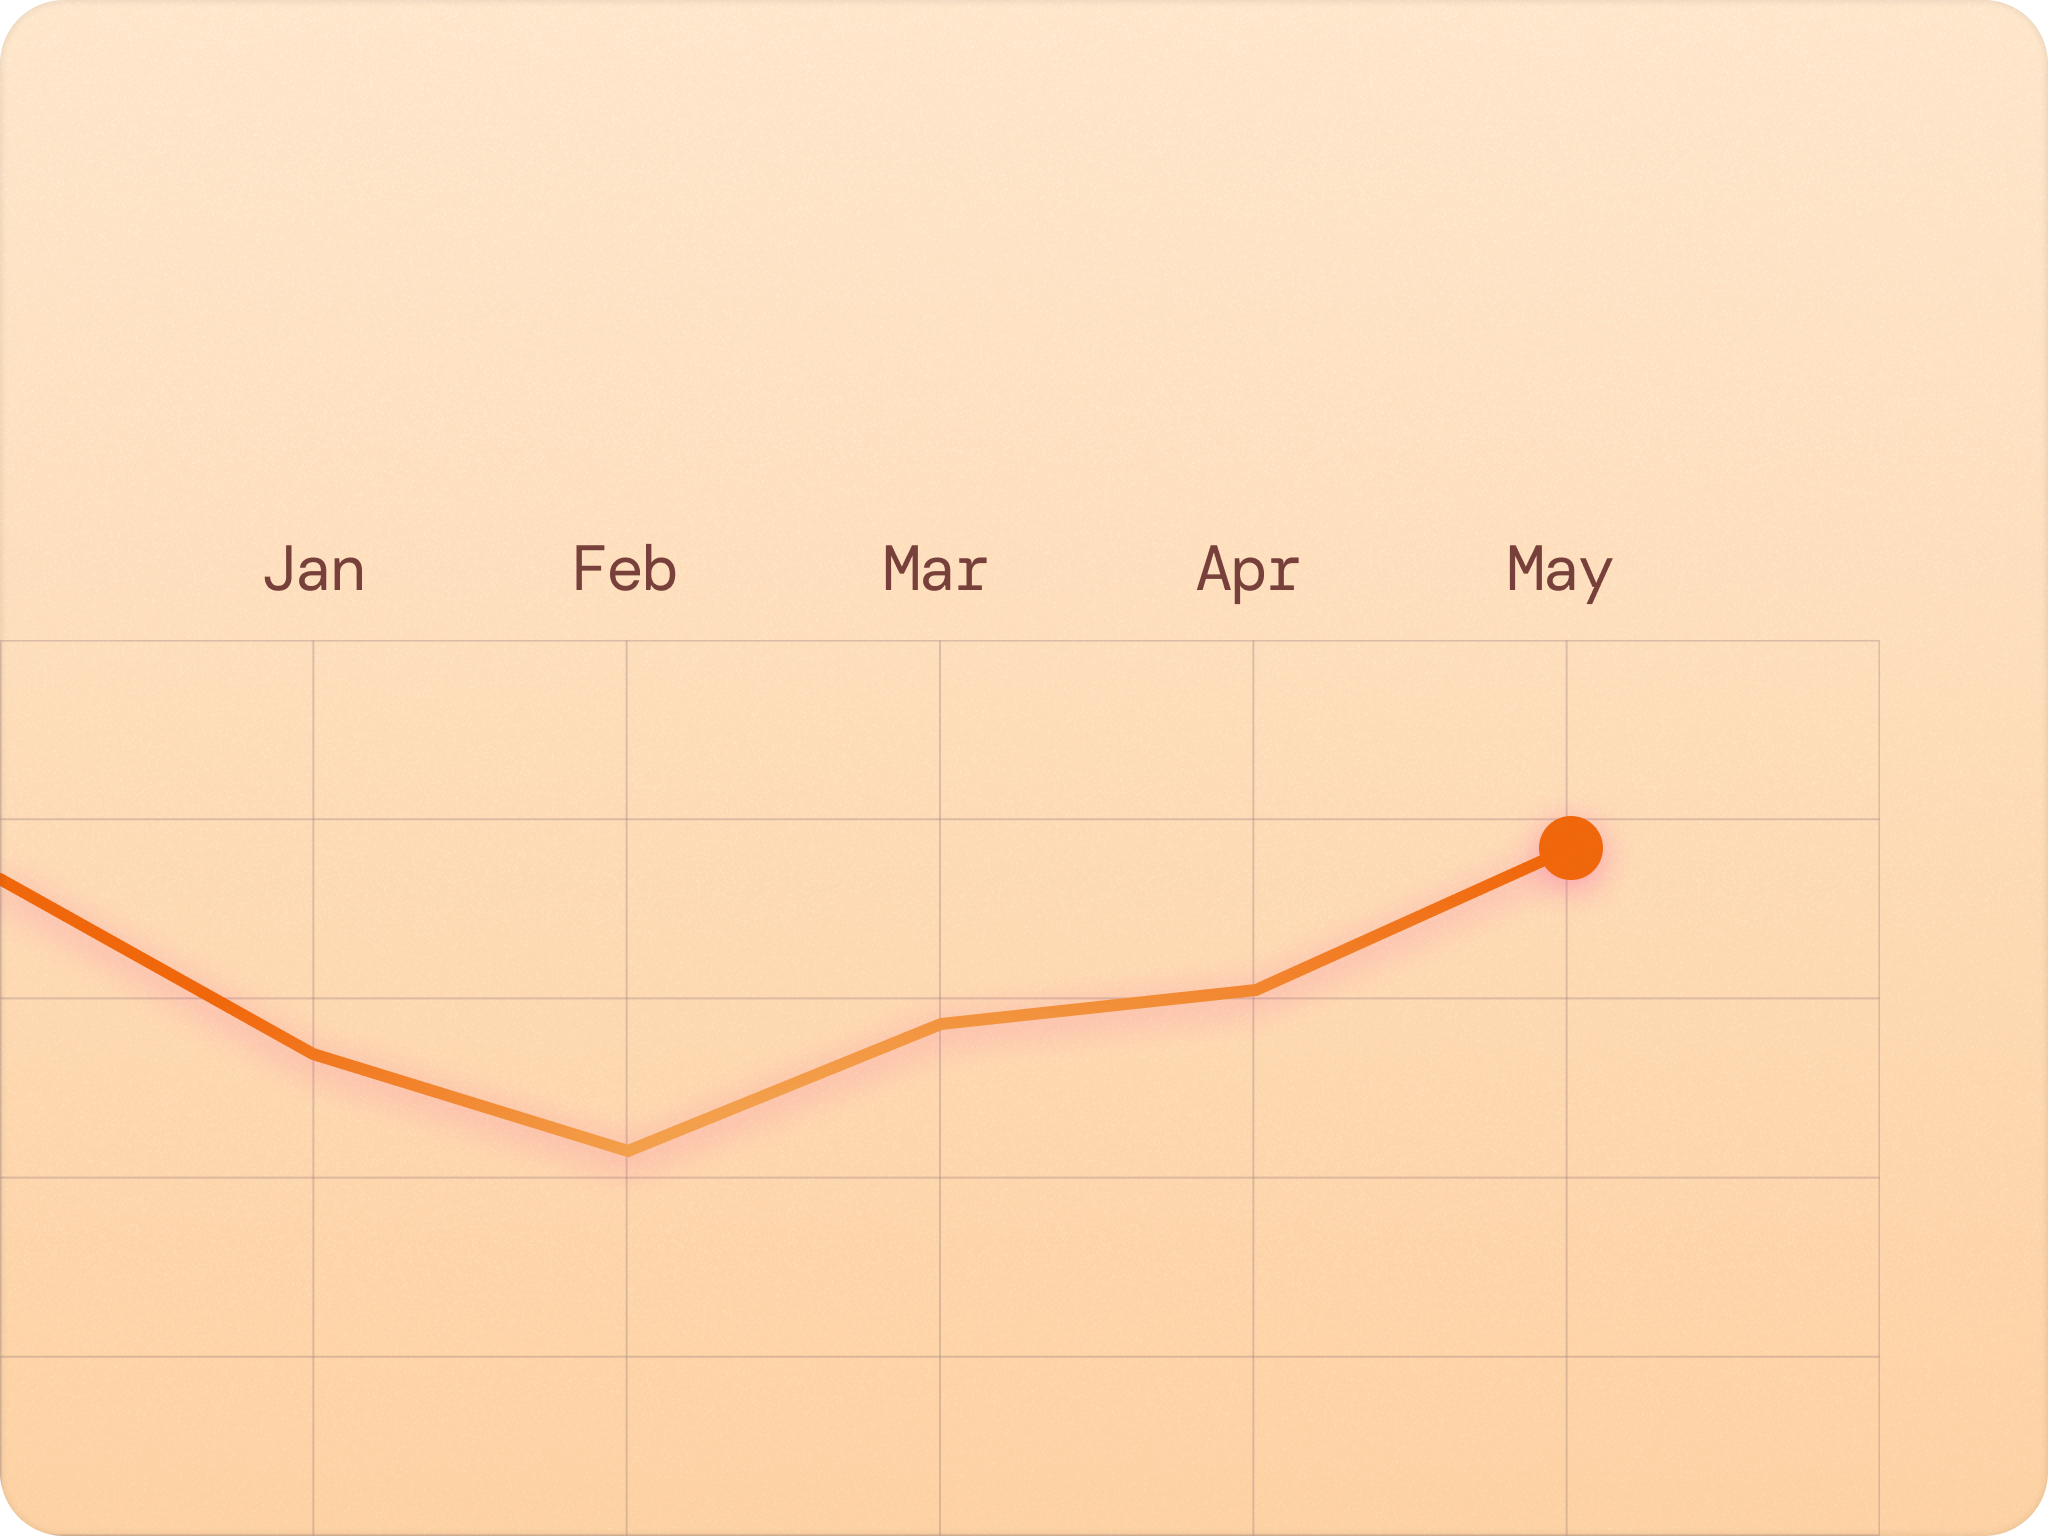
Følg hvordan konkrete engagement-faktorer udvikler sig
Zoios viser hver trivselsdrivers score over tid, så I kan se om anerkendelse, udvikling eller andre faktorer flytter sig op eller ned mellem perioderne. Trendkurverne hjælper jer med at vurdere om initiativerne virker, fx om jeres nye MUS-format reelt løftede udviklingsscoren. Ved at følge de enkelte drivere i stedet for én samlet score forstår I delene af engagement-historien og kan måle effekten af målrettede tiltag.
03
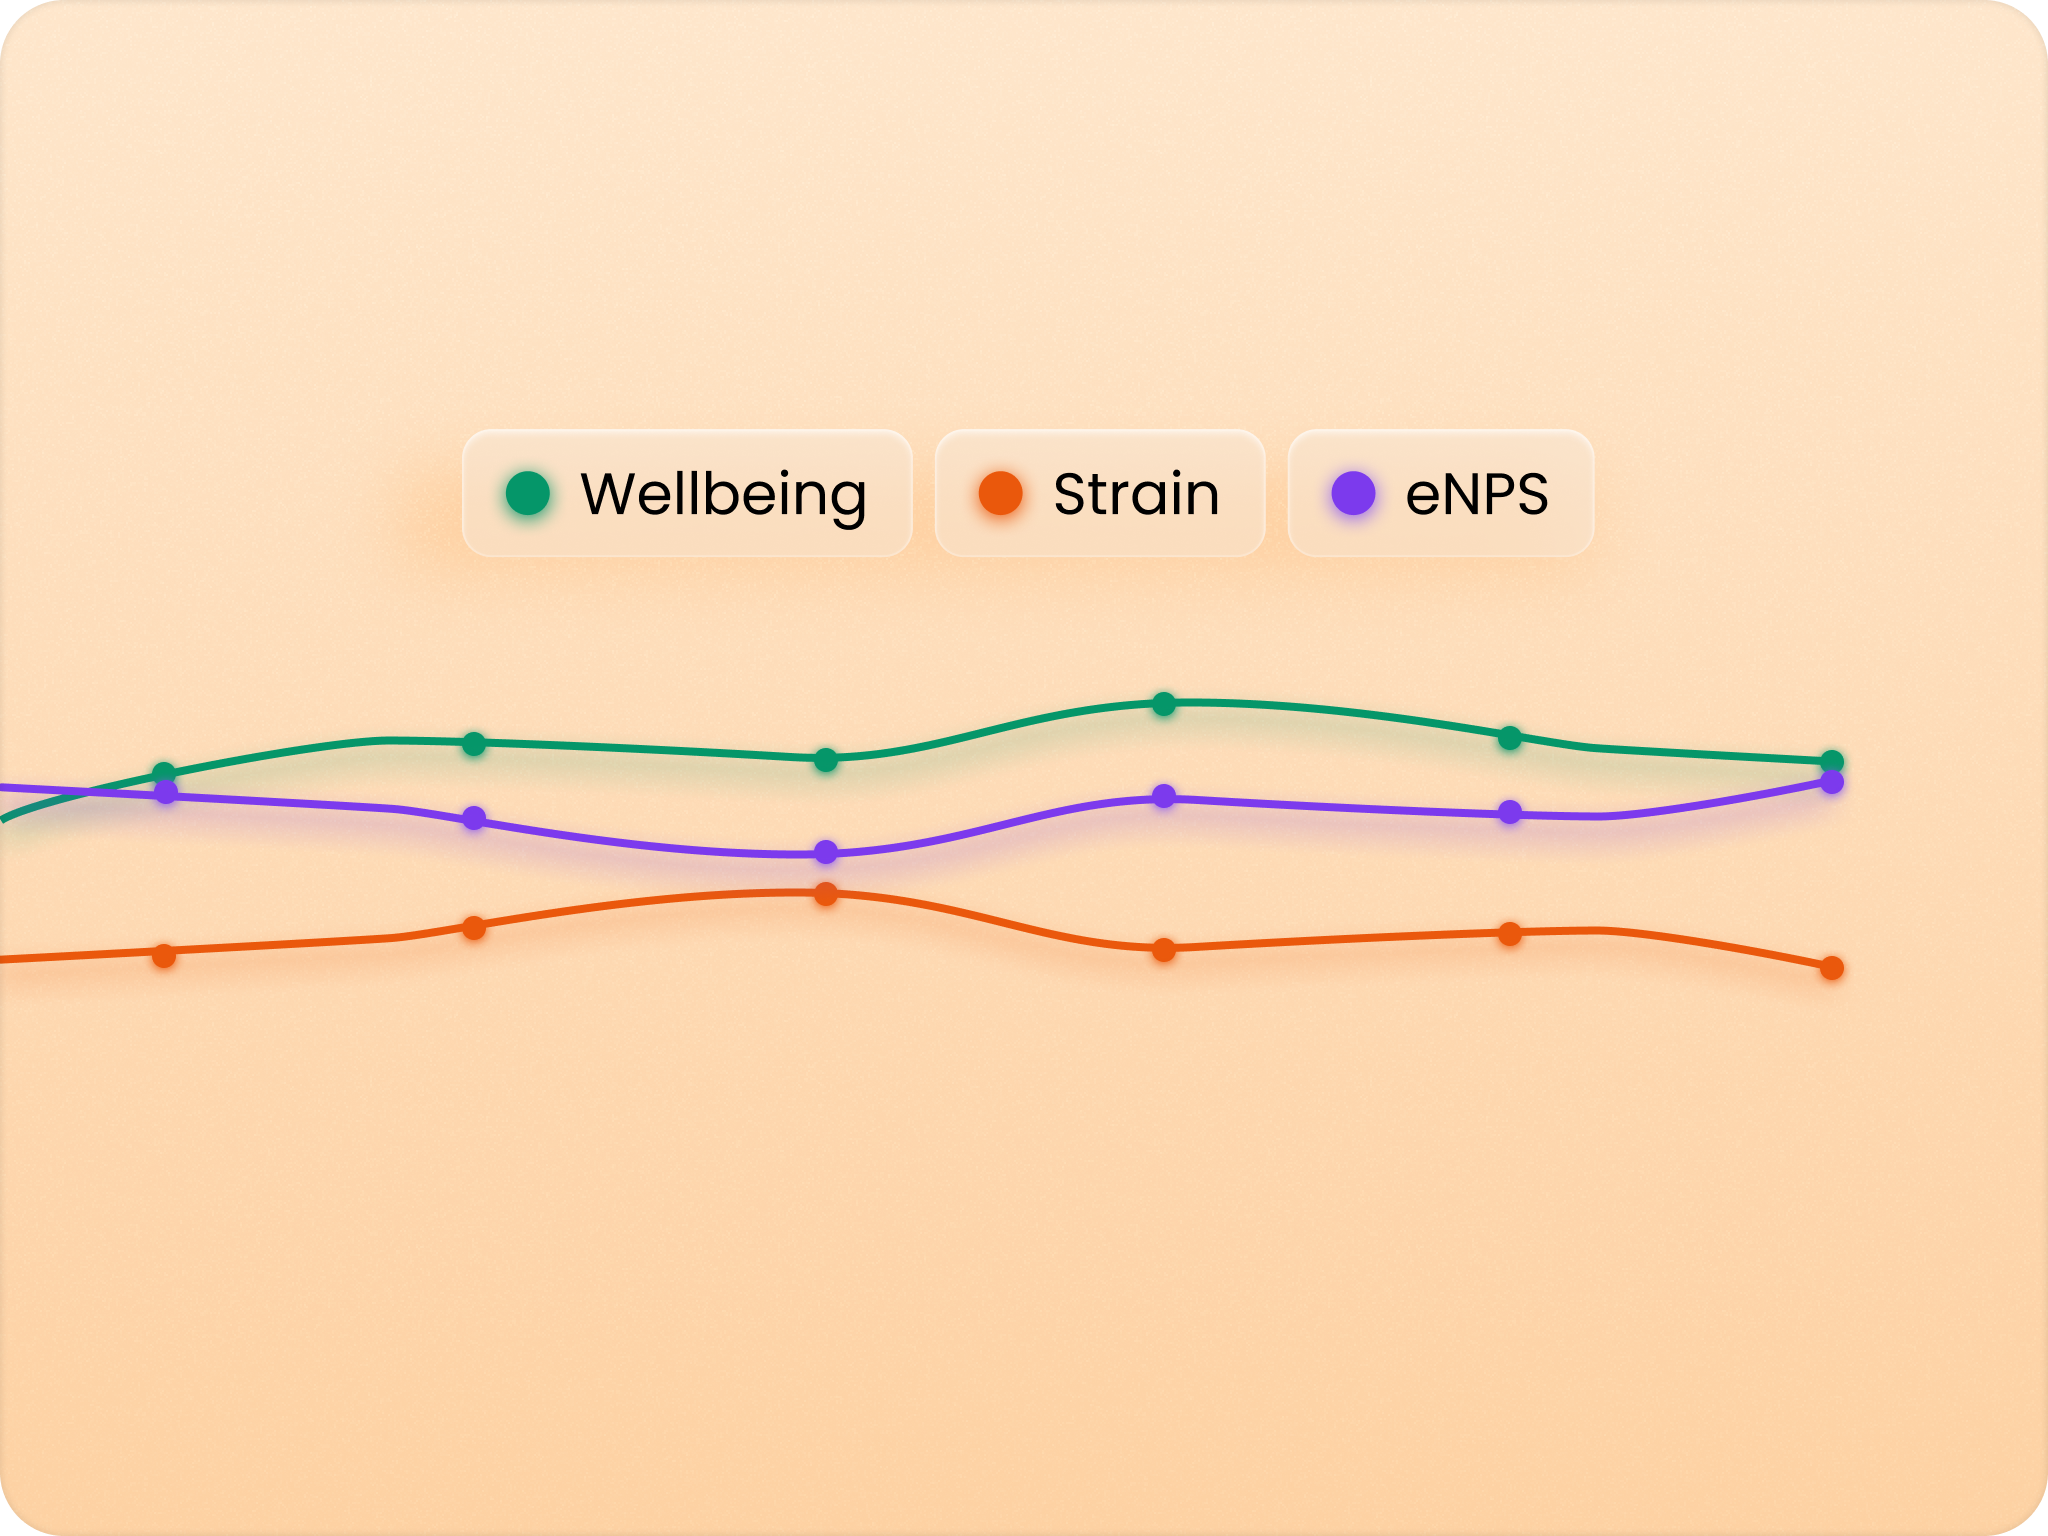
Se hele organisationens engagement-sundhed på et blik
Zoios giver umiddelbar indsigt på organisationsniveau og viser den samlede trivsel, strain og eNPS for hele virksomheden, så snart svarene kommer ind. Dashboardet fremhæver de stærkeste og svageste drivere, svarprocenten og en sammenligning med tidligere målinger uden manuelle beregninger. Det omgående virksomhedsoverblik gør det let for direktion og HR hurtigt at vurdere den organisatoriske sundhed og finde de største kulturelle forbedringsmuligheder.
04
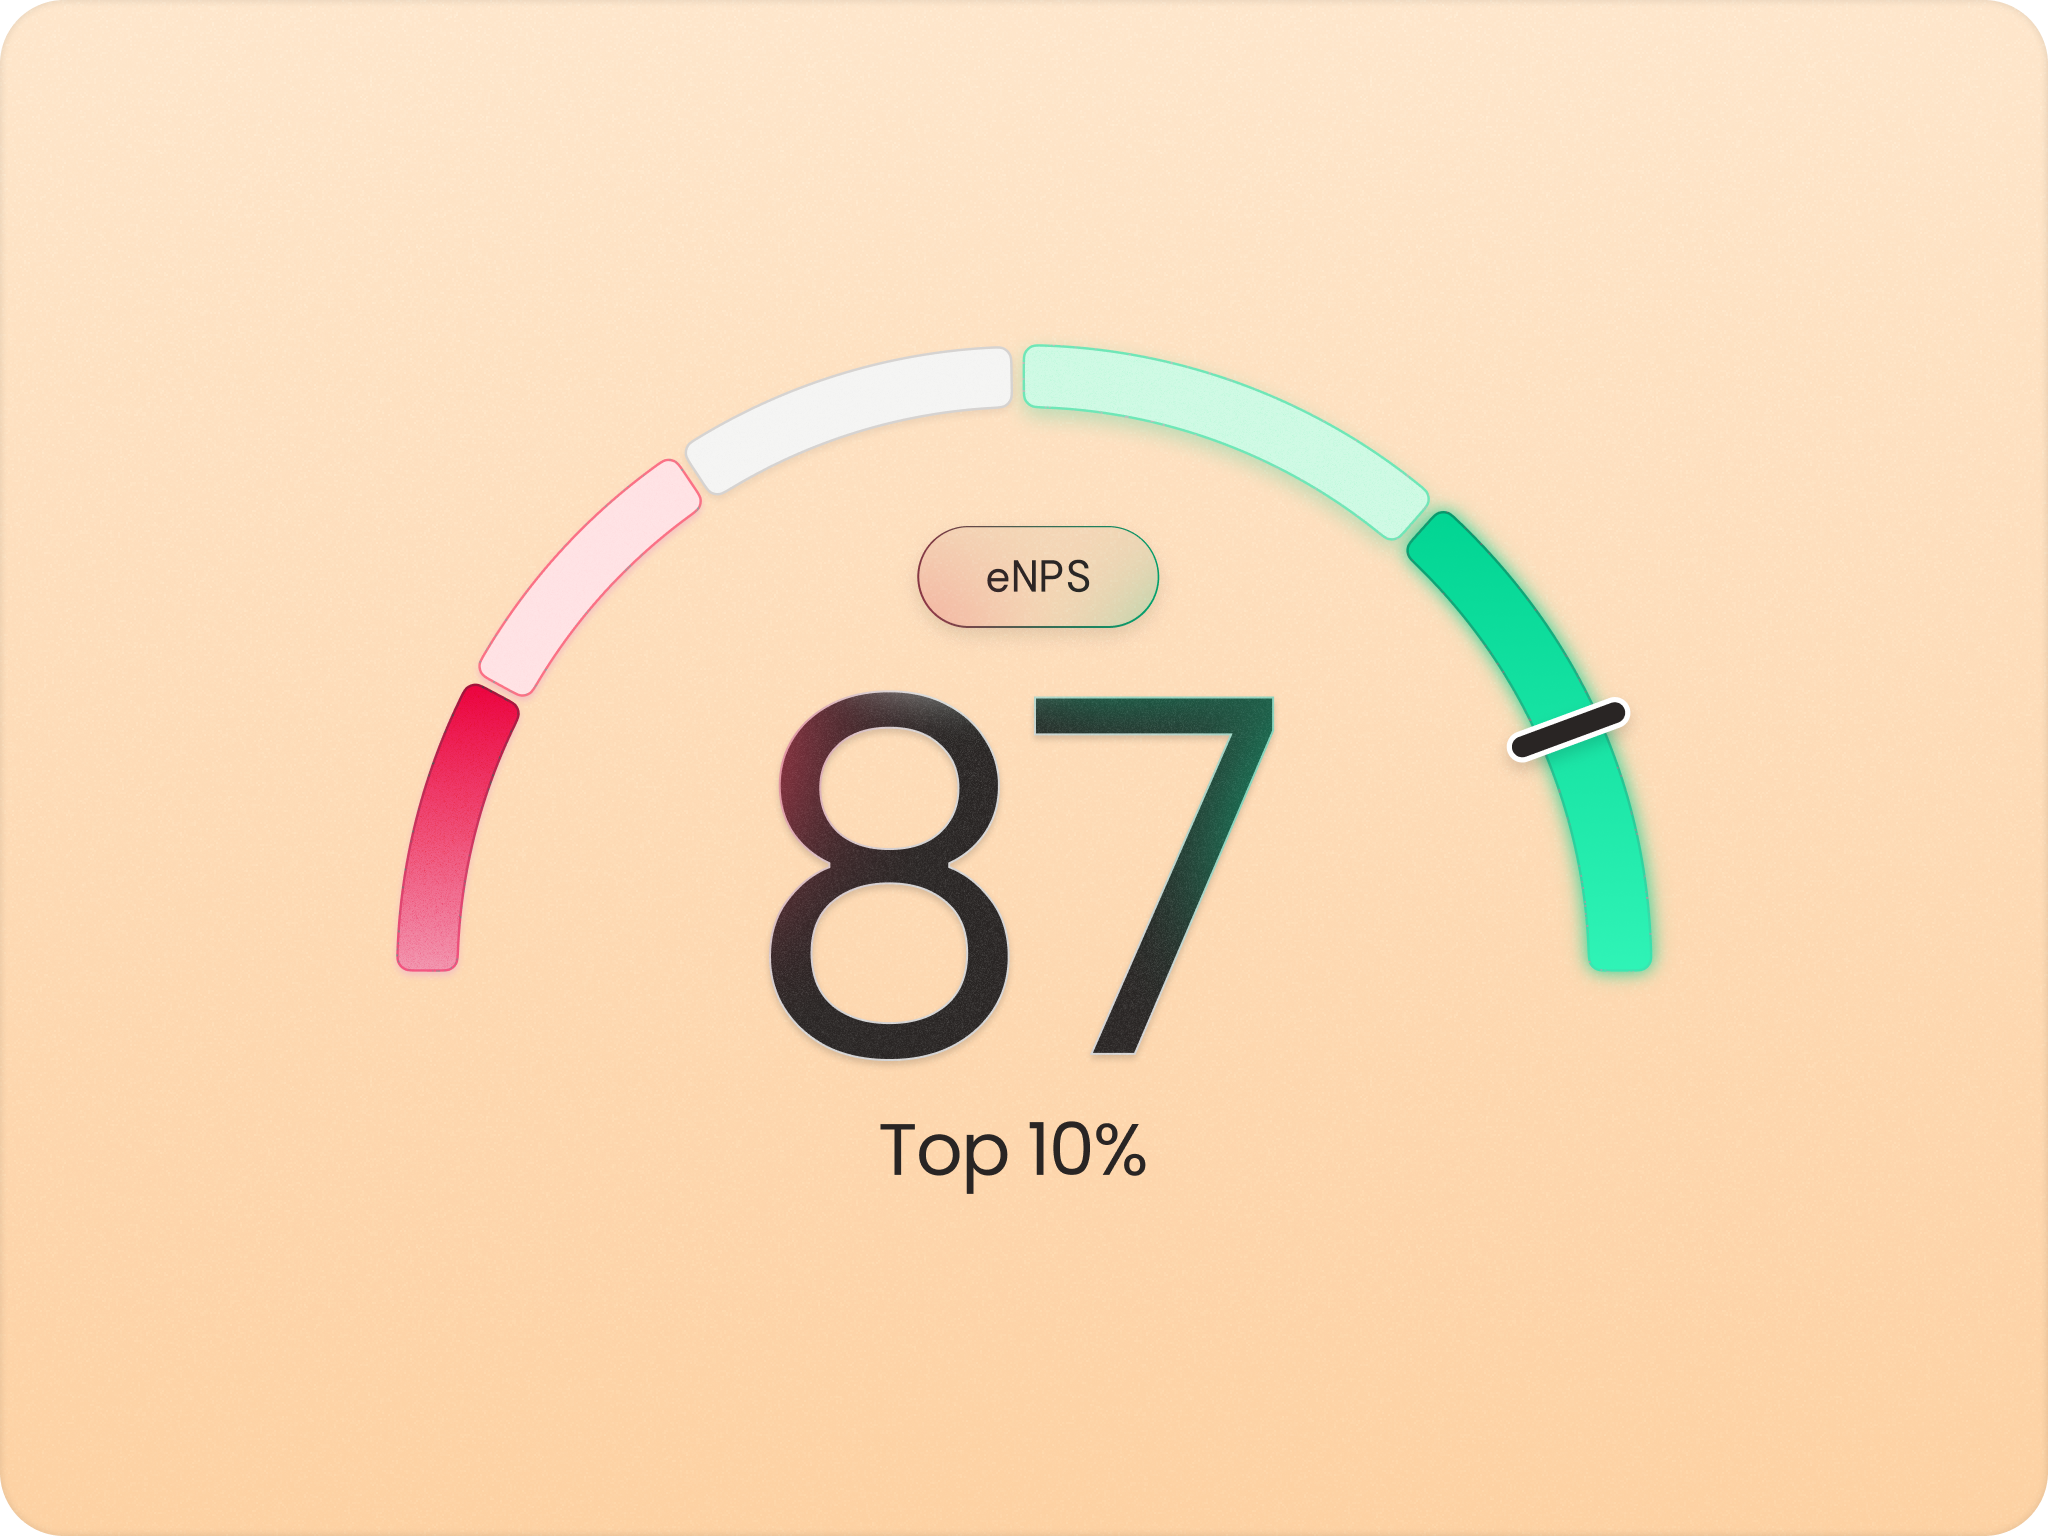
Se hvordan I står sammenlignet med jeres branche
Zoios leverer benchmark-data fra tusindvis af virksomheder, så I forstår hvordan jeres engagement står i forhold til lignende organisationer. I ser om I ligger i top 10%, top 25% eller under gennemsnittet på trivsel og eNPS. Det eksterne benchmark giver perspektiv ud over de interne sammenligninger og gør det lettere at sætte realistiske mål og afgøre, om udfordringerne er jeres egne eller fælles for branchen.
05
Få realtidsindsigt i samme øjeblik målingen lukker
Zoios genererer live dashboards og visualiseringer i samme øjeblik medarbejderne udfylder pulsmålingen, helt uden manuel analyse eller rapportbygning. HR og ledere ser opdaterede trivselsscores, trends og kommentarer i realtid uden Excel eller PowerPoint. Den umiddelbare adgang betyder, at I hurtigt kan reagere på engagement-problemer og træffe datadrevne beslutninger uden forsinkelse.
06
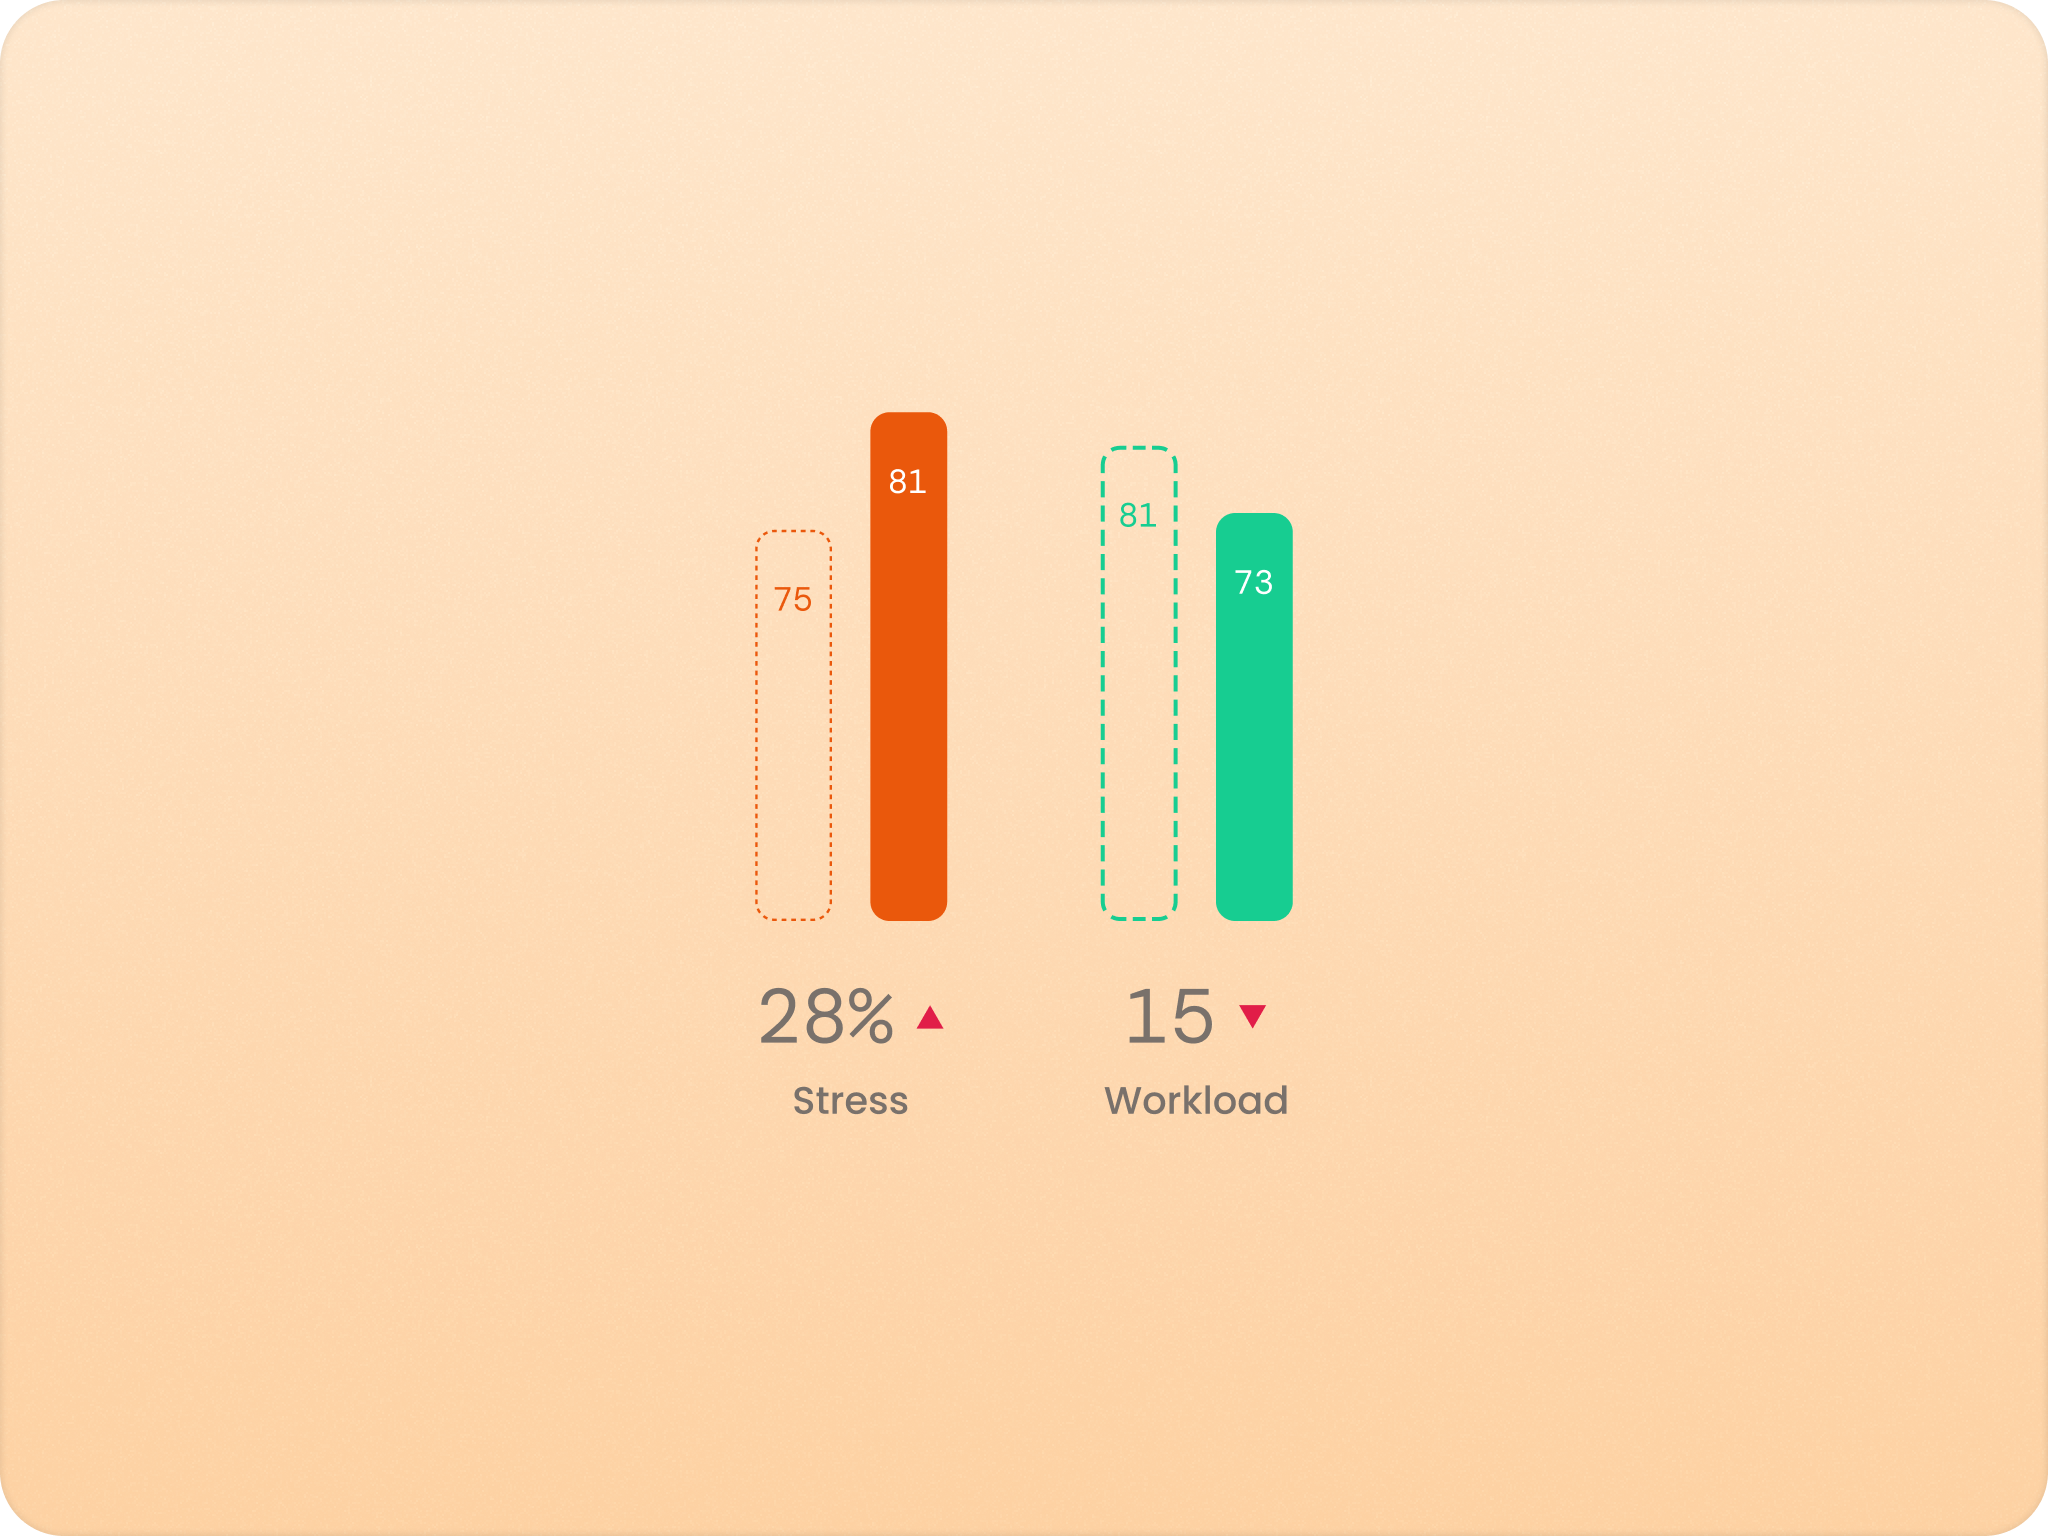
Forstå om stress skyldes arbejdsmængde eller andre faktorer
Zoios giver et arbejdsbyrde-mod-strain-diagram, der afslører, om teamets stress skyldes mængden, eller om det skyldes andre komplikationer som kompleksitet, uklare forventninger eller personlige forhold. I ser teams med høj strain men lav arbejdsbyrde (peger på ikke-mængderelaterede problemer) eller høj arbejdsbyrde uden strain (viser at folk håndterer det). Analysen forhindrer den klassiske fejl, hvor man skærer arbejdsbyrden ned, når det reelle problem er dårligt samarbejde eller uklare prioriteter, og hjælper jer med at ramme den rigtige løsning.
07
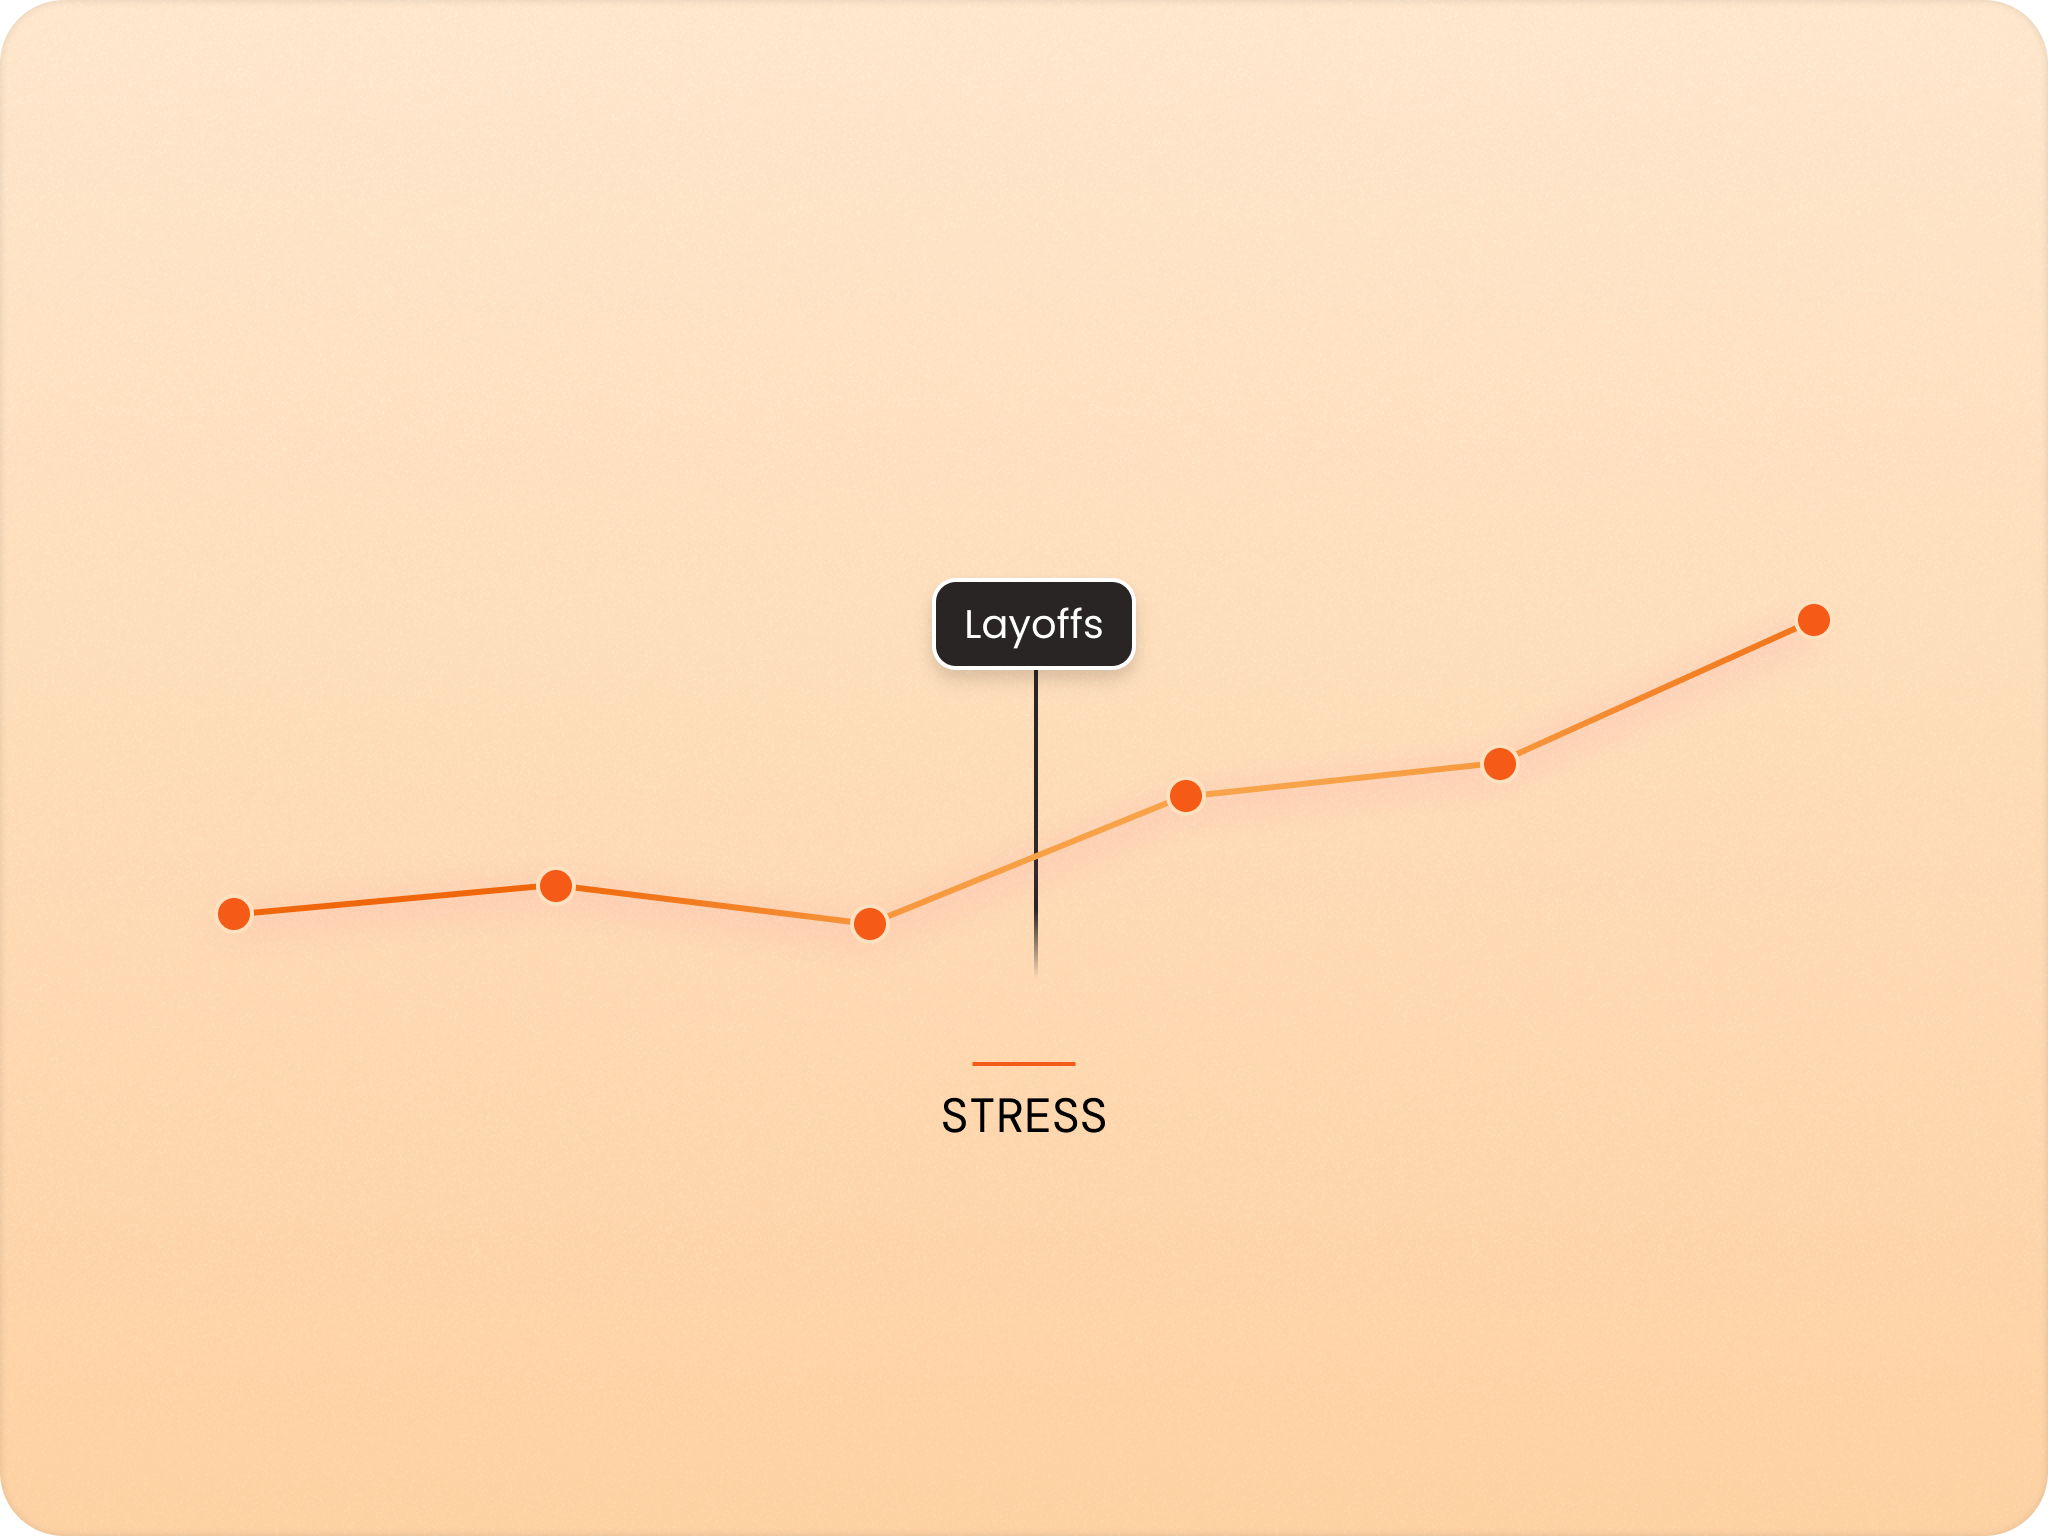
Se præcis hvordan jeres initiativer påvirker engagementet
Zoios lader jer logge vigtige begivenheder og initiativer (lederskifte, nye personalegoder, omstruktureringer osv.) og viser dem som annotationer på engagement-graferne. Når livsharmoni stiger 12 point i marts, ved I, at det faldt sammen med jeres nye fleksjob-politik. Når strain spiker i Q2, kan I koble det til det store klientprojekt, der startede der. Den visuelle kobling mellem handlinger og udfald gør det lettere at forstå, hvad der faktisk flytter nålen.
Enkelte datapunkter fortæller jer hvor I er i dag, men tendenserne afslører hvor I er på vej hen i morgen. Uden at følge engagement over tid flyver I i blinde på de spørgsmål der reelt betyder noget: Bliver det bedre eller værre? Er den bekymrende score i Engineering en midlertidig dyk eller et skred? Forbedrede jeres nye anerkendelsesprogram reelt noget, eller spildte I tid og budget på et initiativ der ikke flyttede noget?
Zoios følger hver trivselsdriver, strain-niveau og eNPS-score over flere måleperioder, så I kan se om scorer forbedres, falder eller holder sig stabile. Visuelle trendlinjer gør det øjeblikkeligt tydeligt, hvilke teams der bevæger sig op og hvilke der glider ned. I opdager Engineering-teamets trivsel falde tre måneder i træk, før det bliver til en fastholdelseskrise, eller bemærker at Sales-teamets anerkendelses-scores er steget 15 point efter peer shoutouts blev indført.
Det historiske blik forvandler engagement-måling fra snapshots til historier. I kan endelig svare på, om jeres kulturinitiativer virker, eller spilder ressourcer. I fanger problemerne tidligt, mens de stadig kan løses, og griber ind når scoren begynder at falde i stedet for at vente på massefratrædelser. Det vigtigste er, at I bevæger jer fra reaktiv brandslukning til proaktiv ledelse, og adresserer engagement-problemer før de bliver til dyre organisatoriske problemer, der skader moralen og driver jeres bedste folk ud af døren.
Vil I se det i praksis?
Sæt jeres første måling op på minutter.
Zoios er gratis at komme i gang med. Prøv det med jeres team, eller tal først med et menneske. I bestemmer.