Our engagement platform is easy to use, build on data science, a lot of automation and provides concrete AI-driven insights and recommendations at all levels.
© Zoios. All Rights Reserved.
We have already done it for


The platform is meant to spark honest conversations and drive actions both on a team-level but also for the organization with data-driven insights.
Our survey and questions are all derived from scientific studies and backed by extensive data science work.

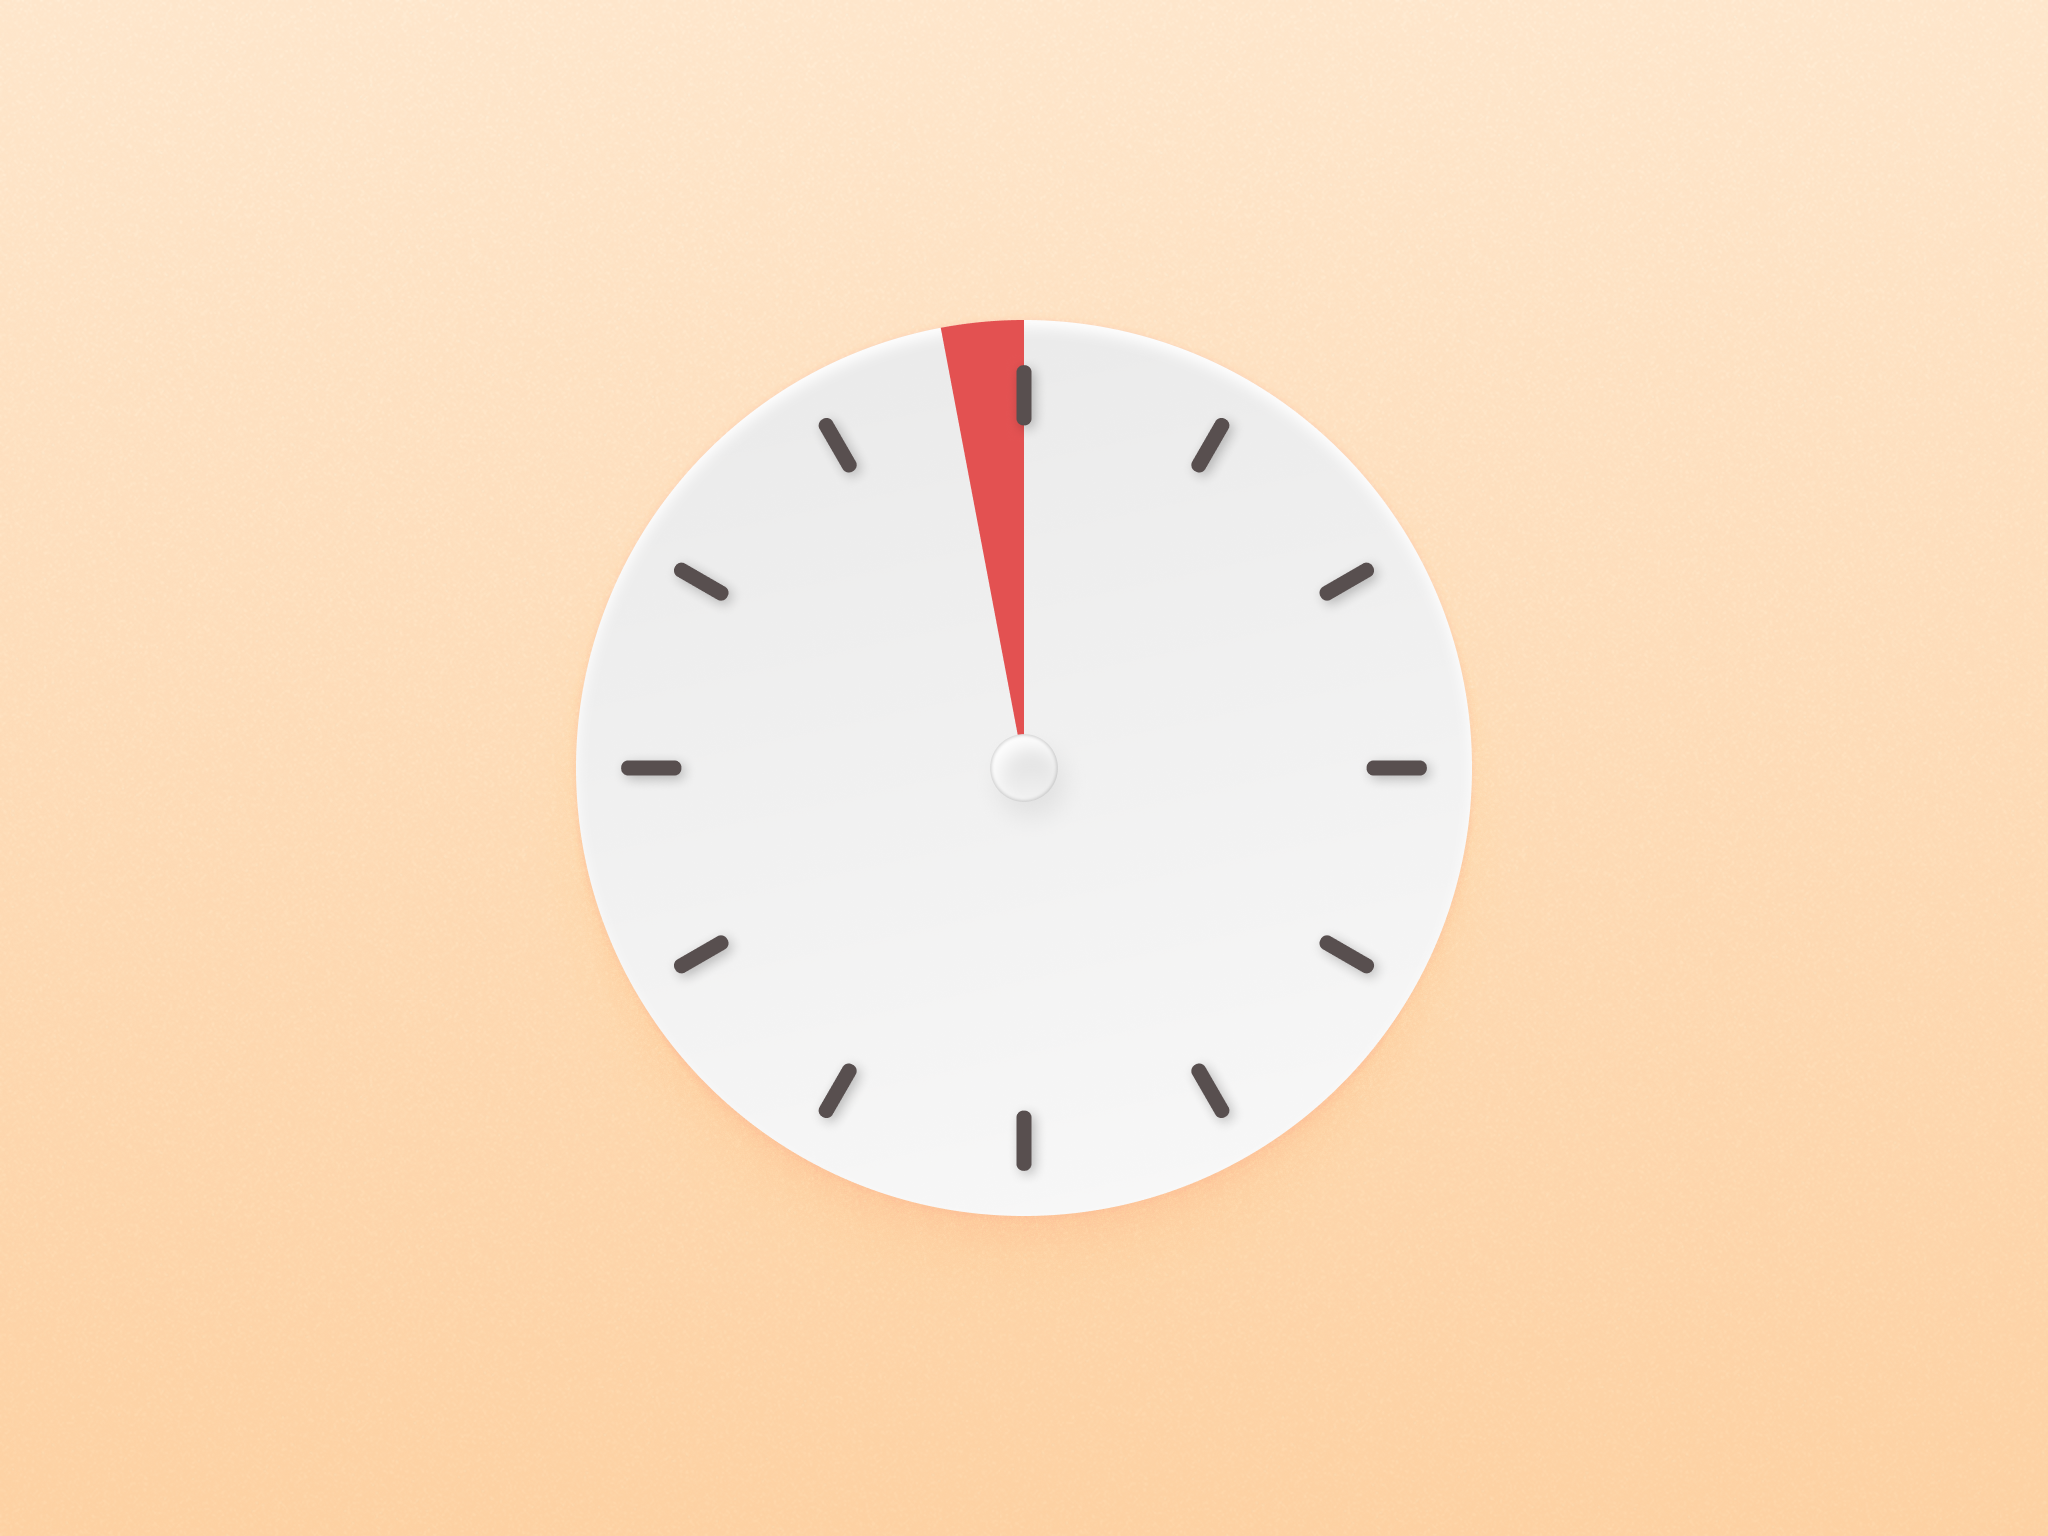
Zoios is extremely easy, takes just 2 minutes to answer and everything flows automatically.
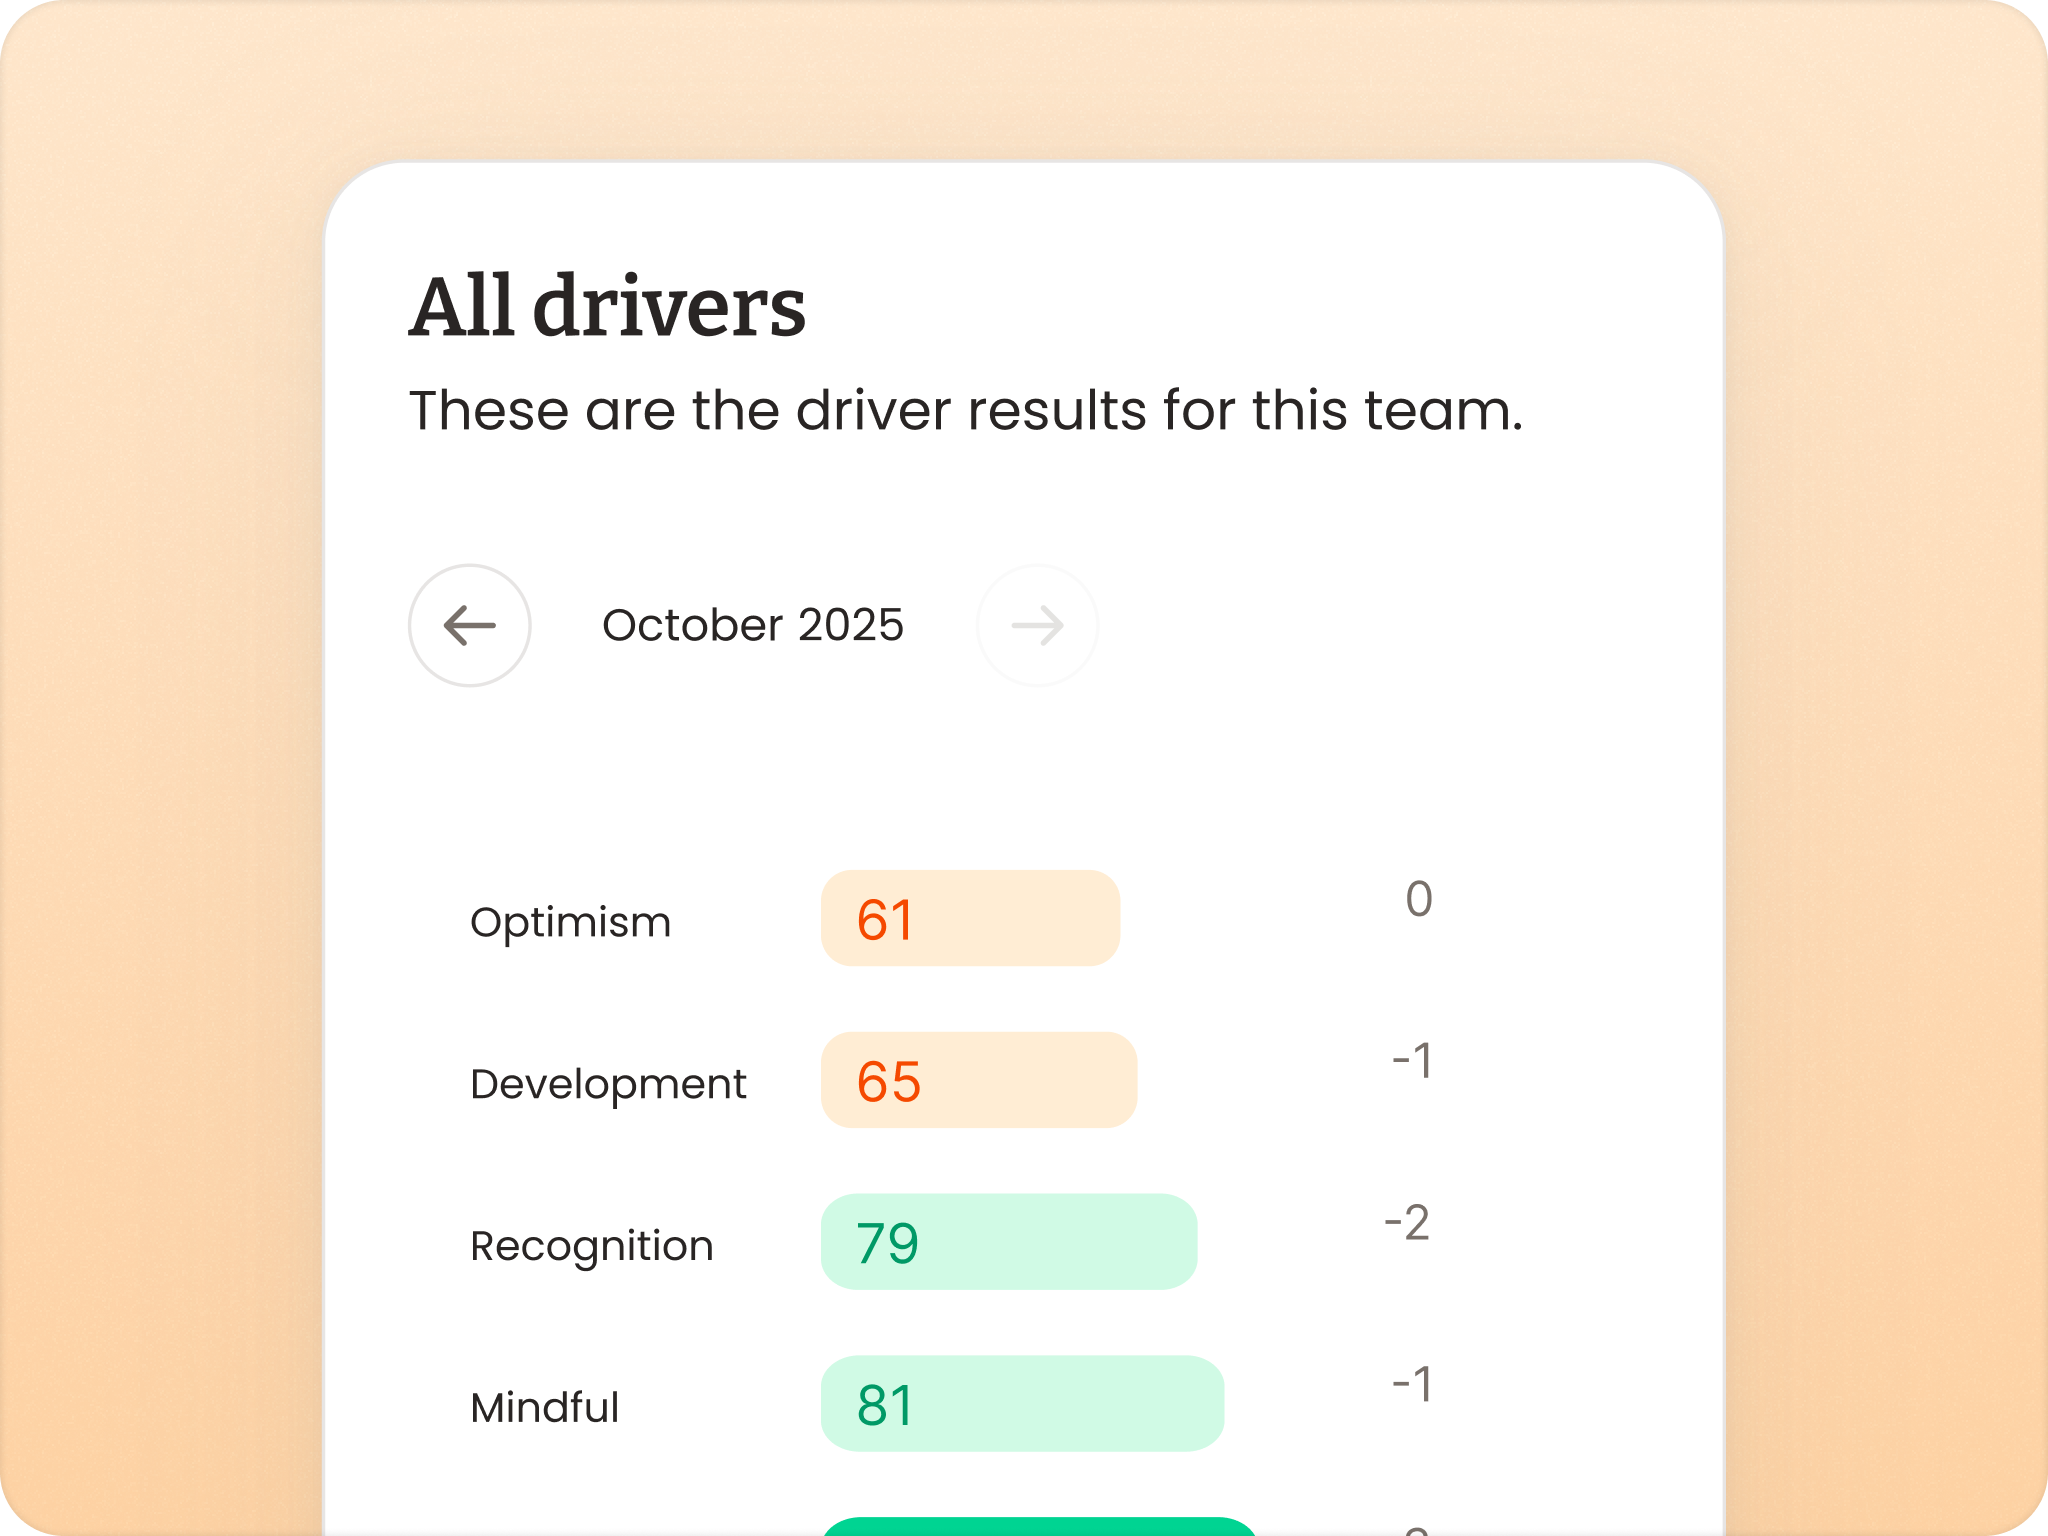
Get an objective assessment with benchmarks against other workplaces in your market and industry.
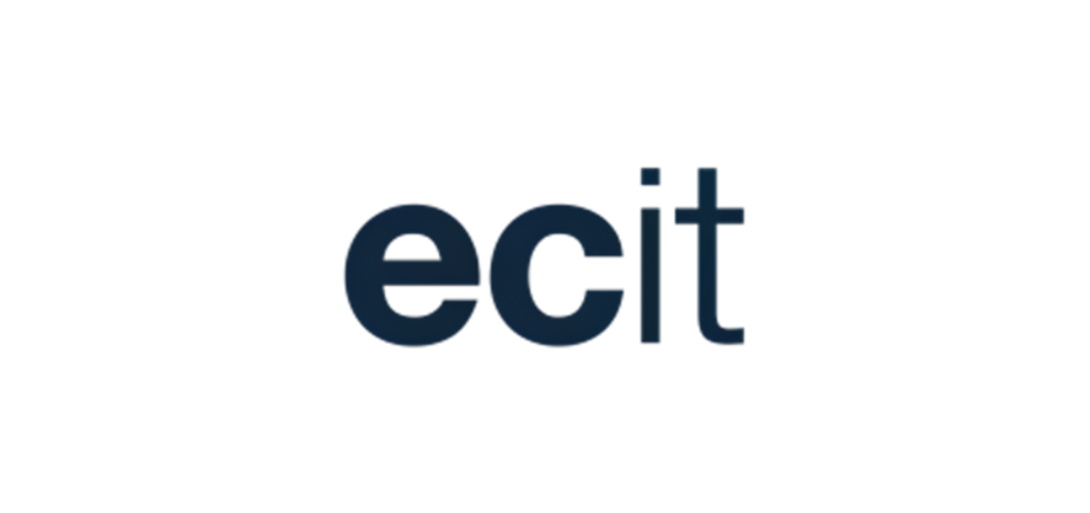
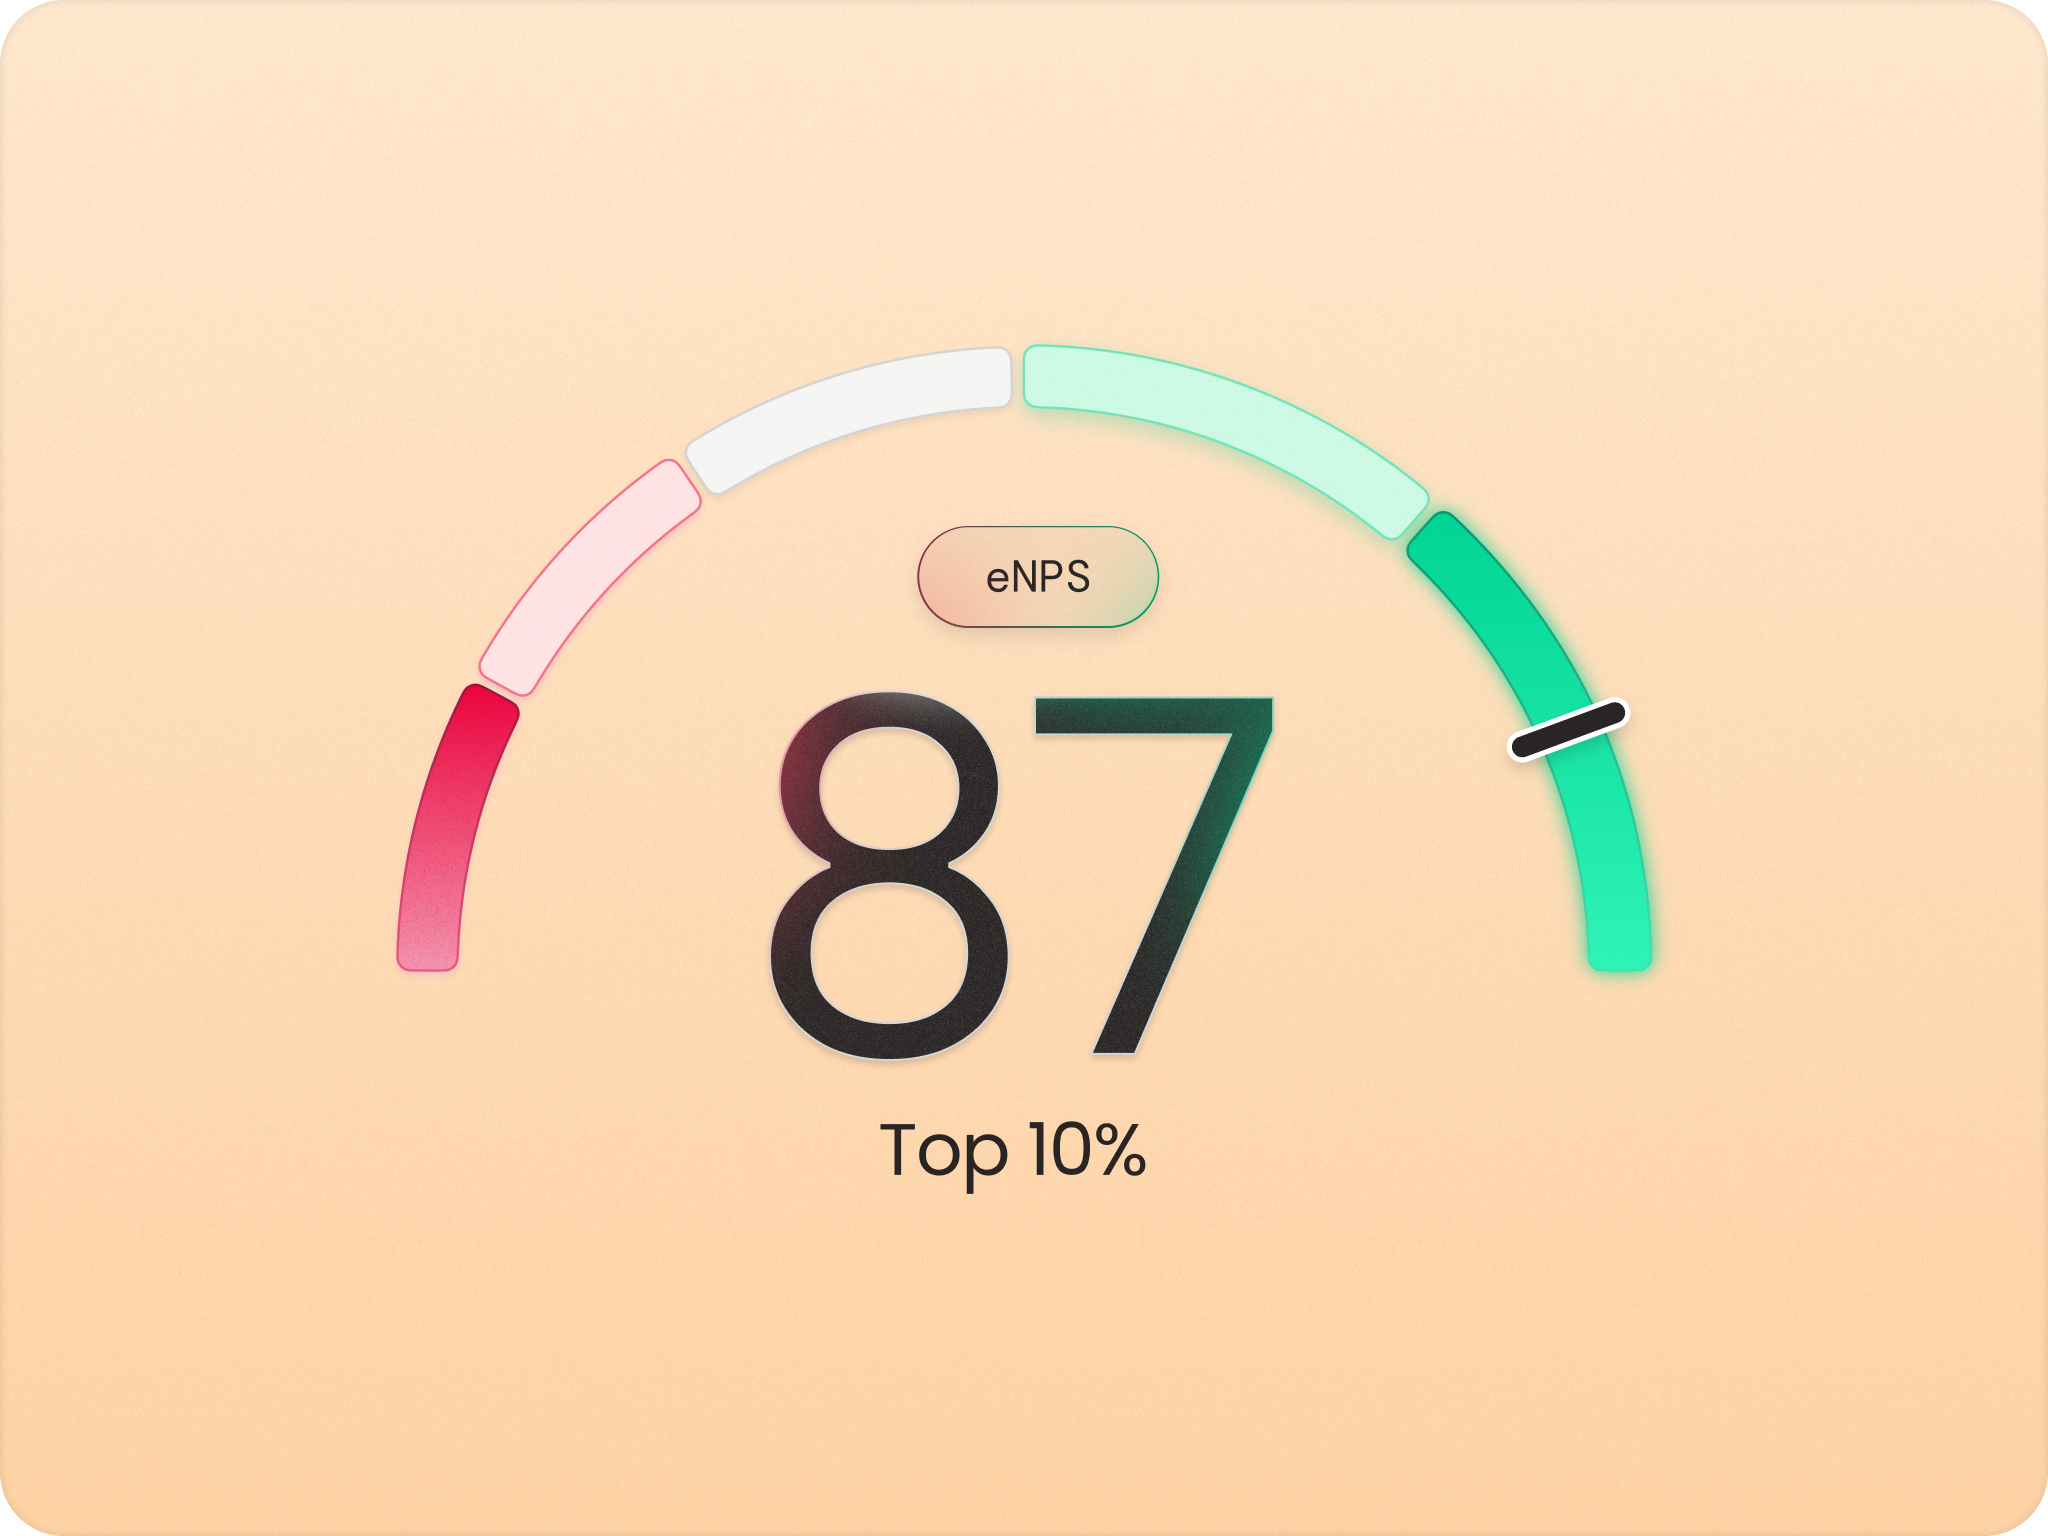
See the results for every country, department, division, team, gender and age in intuitive dashboards.
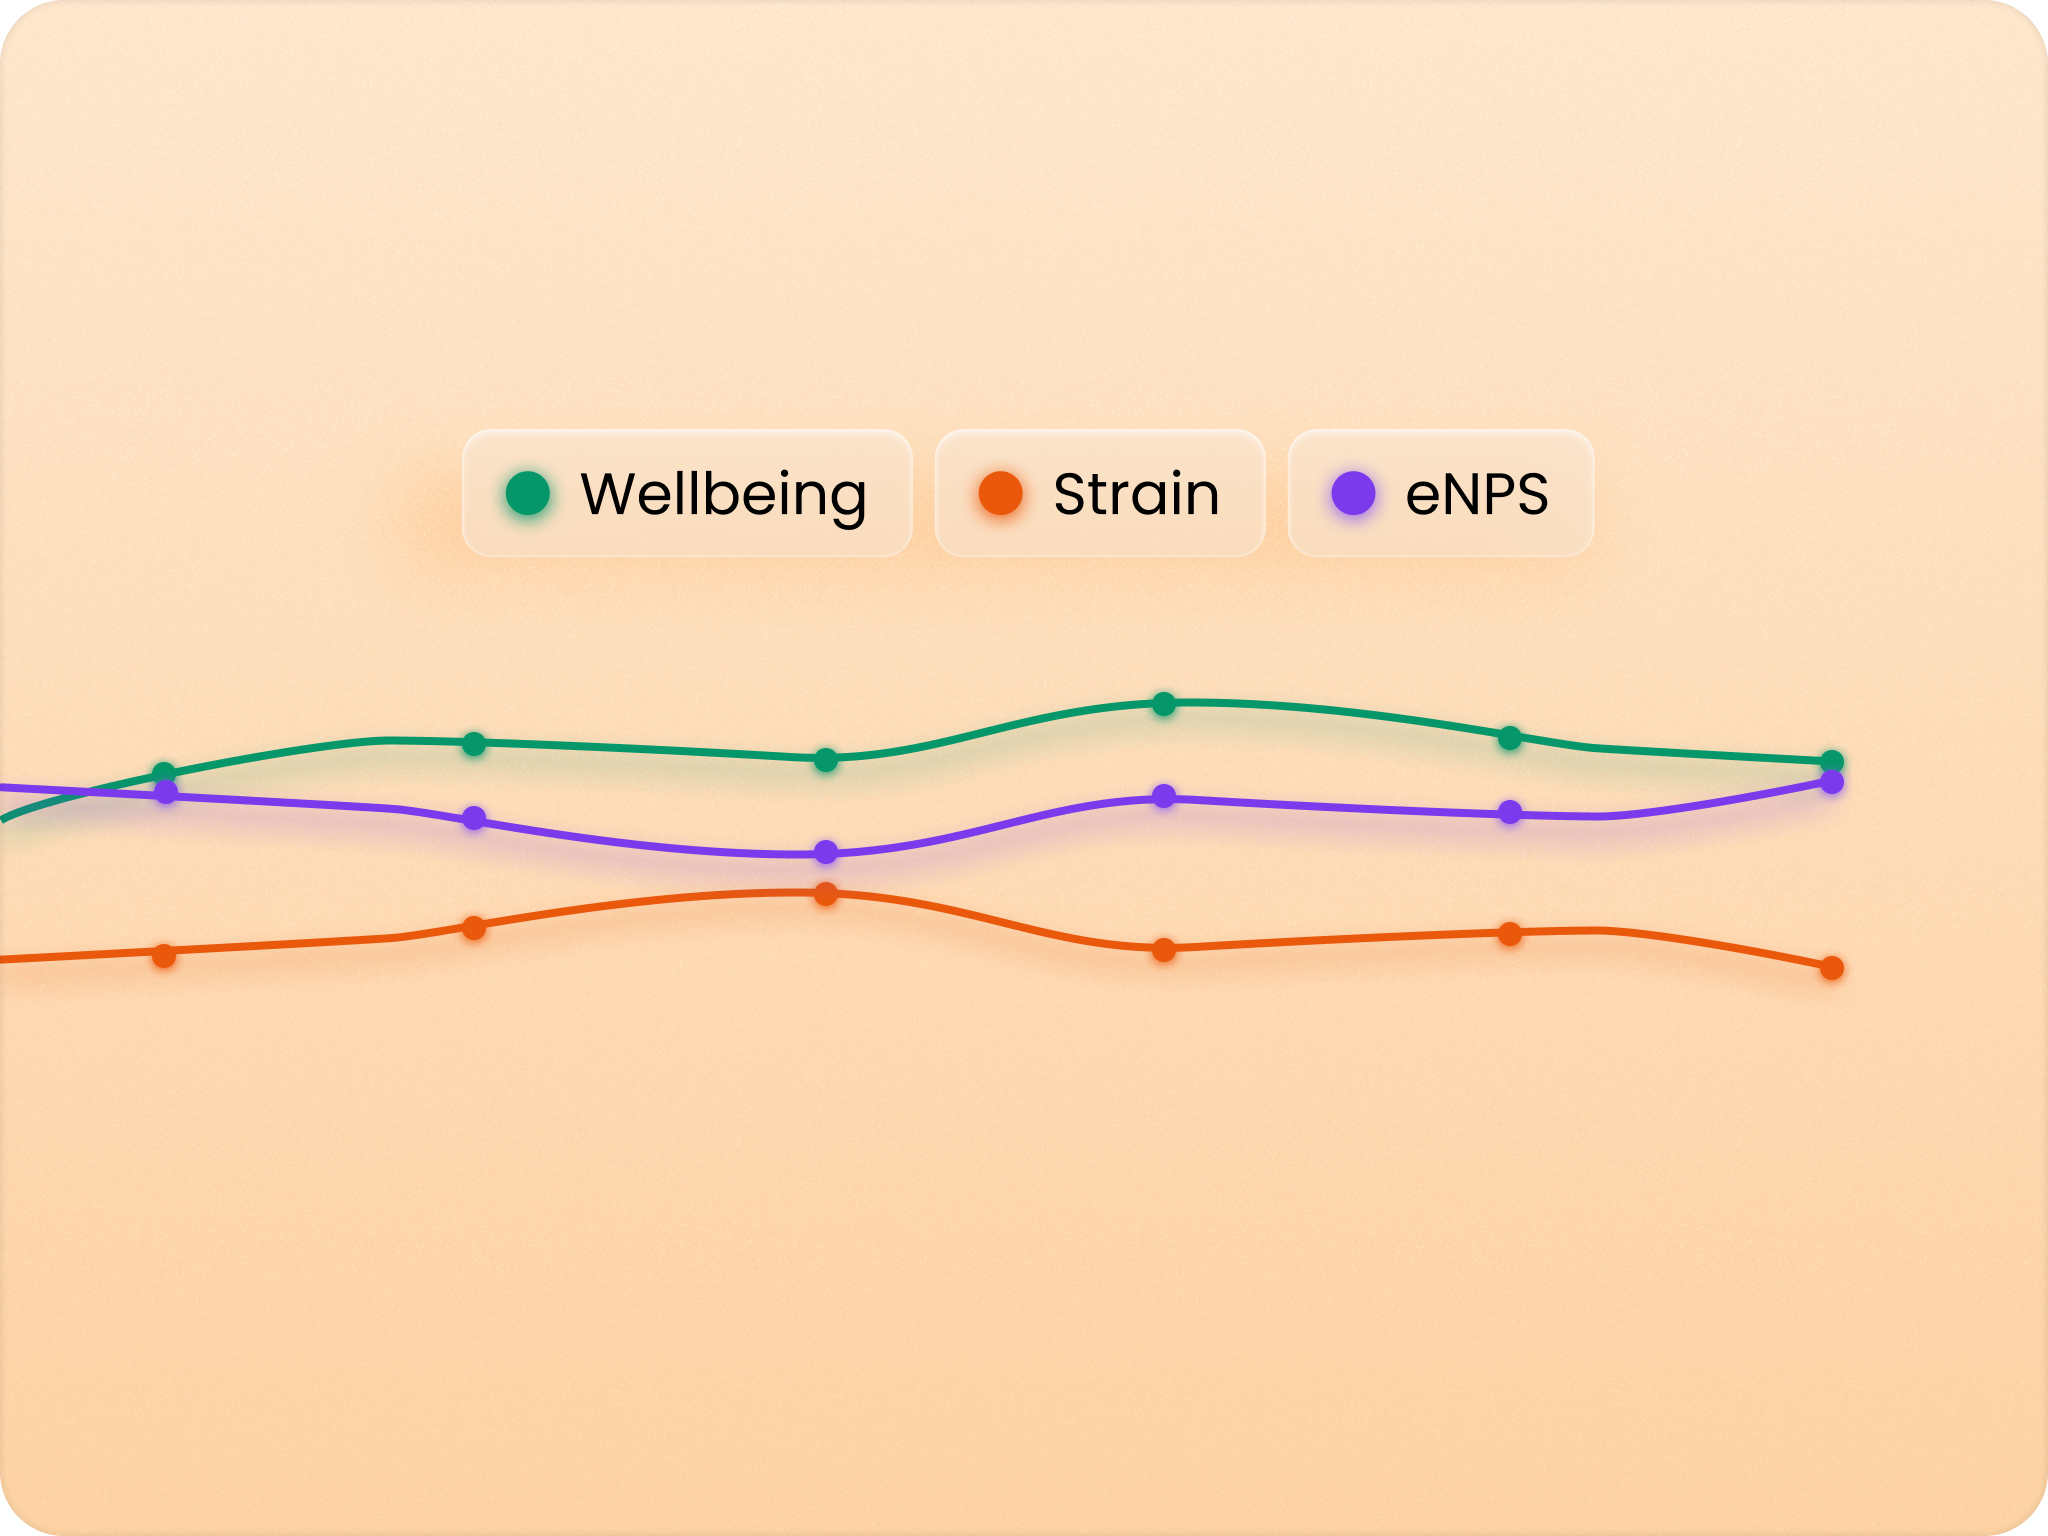
As important as the actual score is the movement and trend over time, which you can easily follow in Zoios.
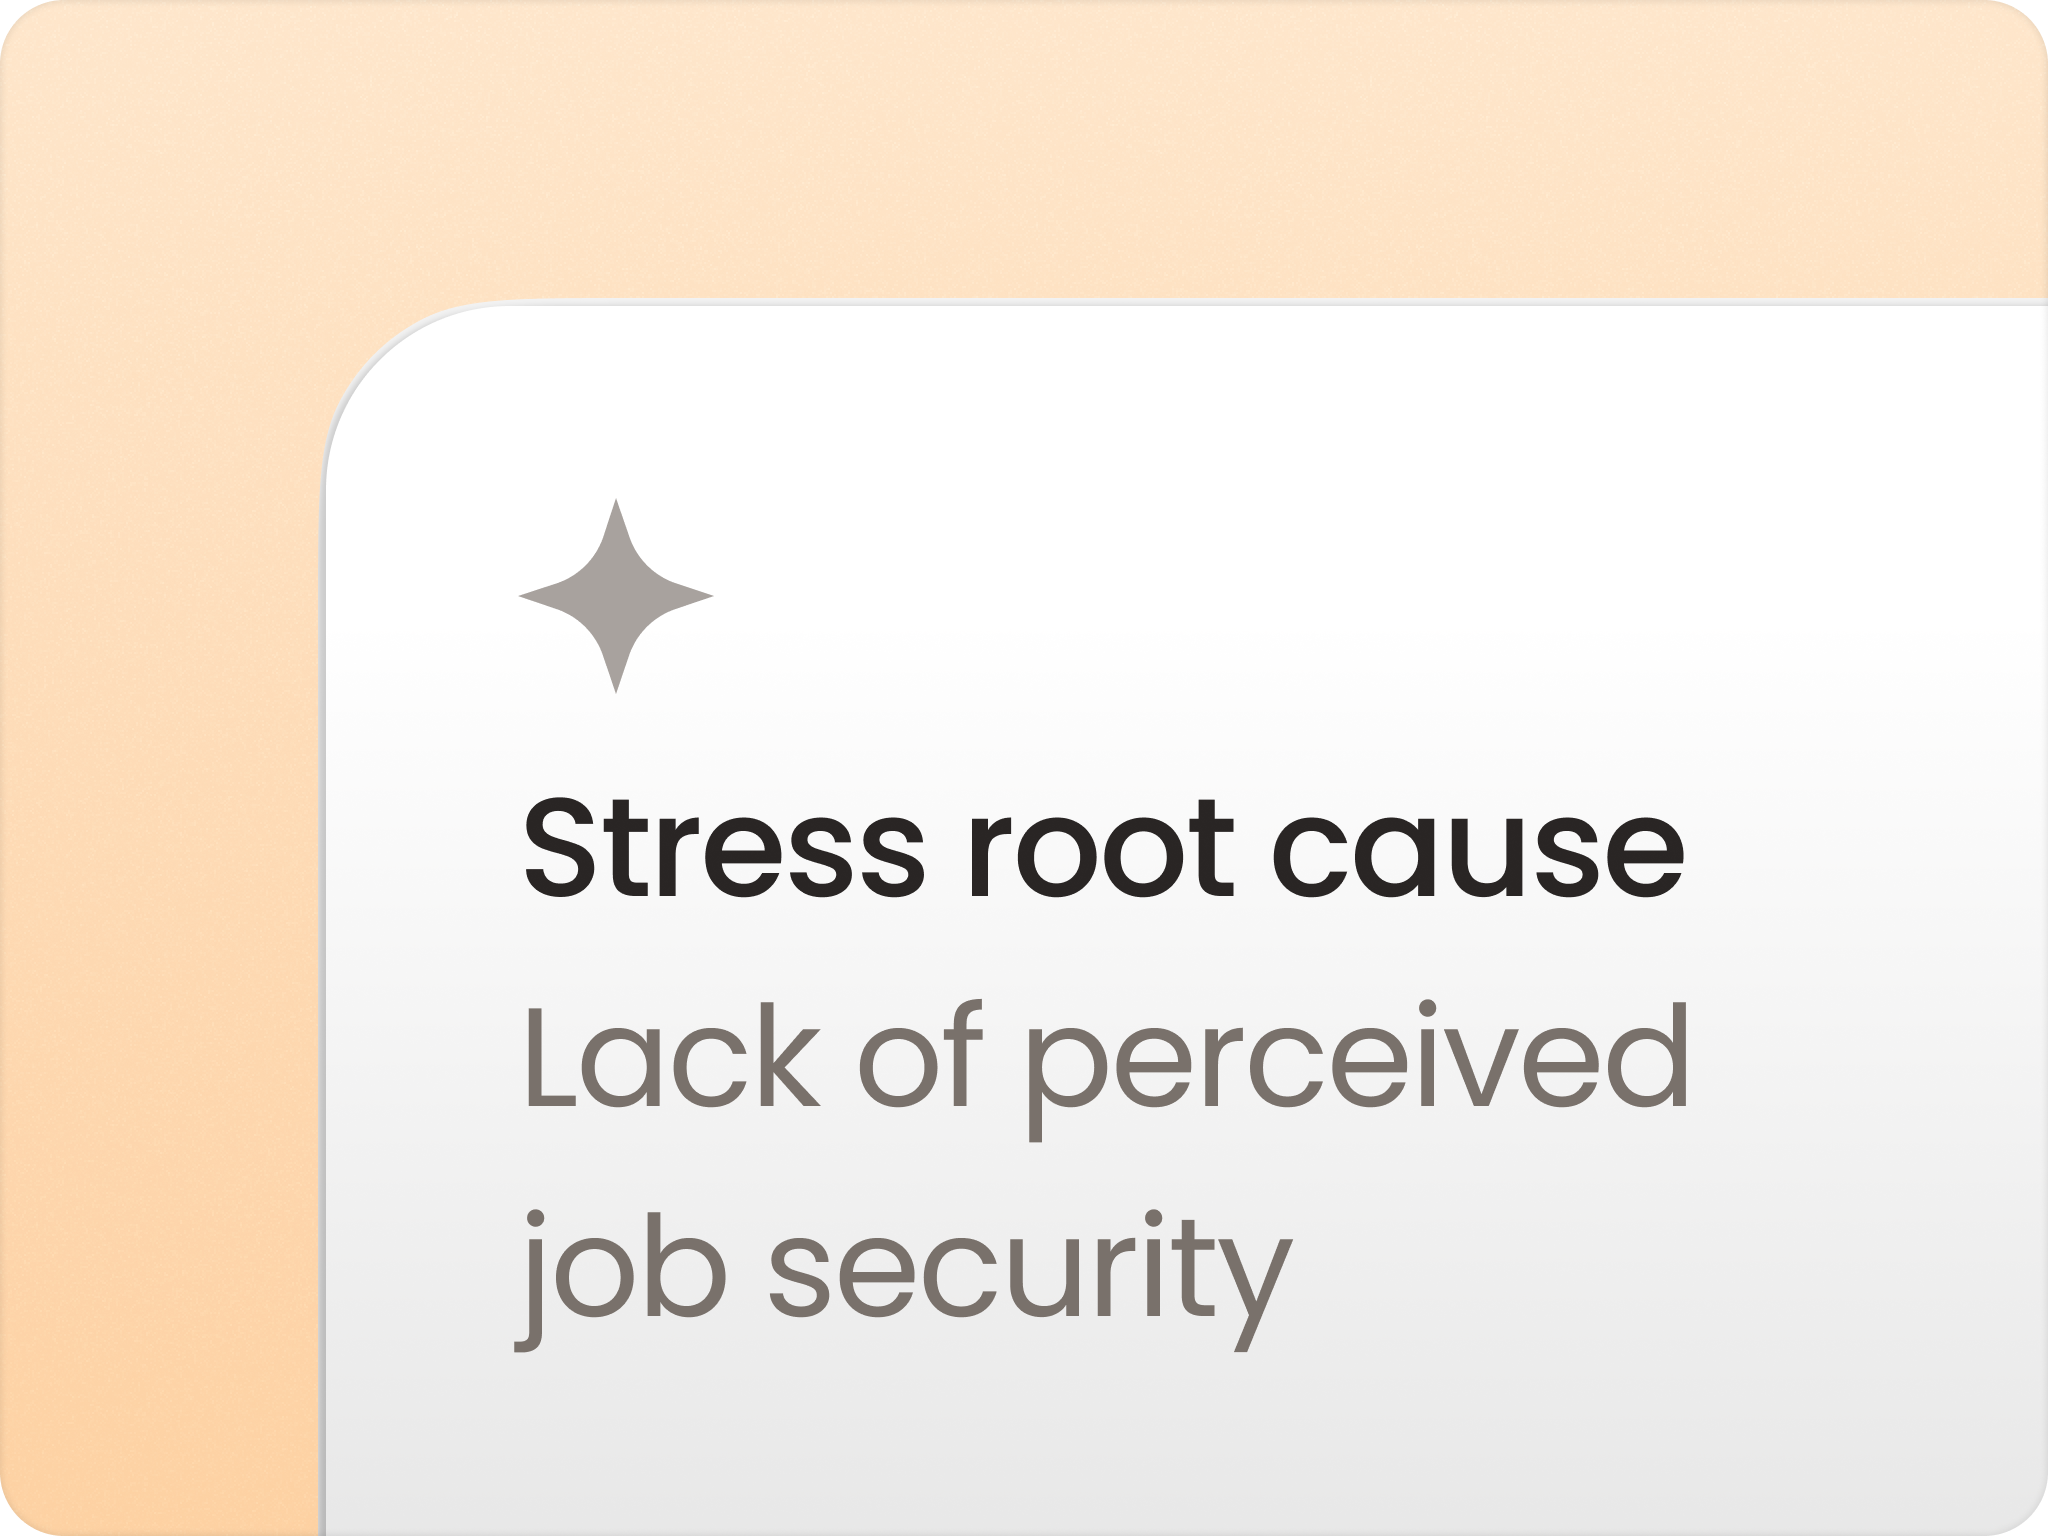
Our big data model uses trained models to make holistic root cause analyses and suggest real actions.
You can granulate the data and have more detail in terms of what is happening...
So when we have a feeling we can actually validate if it's something we need to tackle or not. That's very powerful.

Liking what you see and want to learn more?
We can follow the trends and facilitate dialogues to make small or large changes in our everyday work-life - to ensure we accommodate what motivates people and develops them as consultants.
Employee engagement sounds simple. Are people thriving? Are they motivated? Do they care about their work? But most companies turn this straightforward concept into a bureaucratic mess that produces data nobody uses.
The typical approach: annual survey, 60 questions, designed by a committee of executives who've never actually filled one out themselves. By the time results trickle down to managers, the data is months old and the workplace has completely changed. Nobody takes action because nobody knows what action to take.
Your employees' engagement levels change weekly based on projects, deadlines, team dynamics, and a hundred other factors. Measuring it once a year is like checking your bank account in January and assuming the balance stays the same until December.

"Do you feel valued?", "Are you aligned with company values?", "Would you describe our culture as collaborative?" These questions sound professional, but they don't tell you whether someone is actually engaged or about to quit.
The problem with vague, “feel good” questions is that they don't correlate with actual outcomes. Someone can feel "valued" and still leave for a 10% raise. Someone can say the culture is "collaborative" while secretly hating their job.
Scientific research has identified specific drivers that actually predict whether employees are thriving and motivated: autonomy, recognition, development opportunities, workload balance, role clarity, and connection to the work itself. Ask about those. Not about abstract concepts like "alignment" or "culture."
Using a validated framework also gives you industry benchmarks. Without benchmarks, you have no idea if your engagement score of 65 is actually good or terrible.
Here's what happens with long employee engagement surveys: your most disengaged employees don't finish them. Your most engaged employees begrudgingly complete them out of loyalty. Your middle 60% (the people you actually need data from) abandon them halfway through.
A 40-question survey doesn't give you 4x more insights than a 10-question survey. It gives you survey fatigue, declining response rates, and less honest answers as people rush through just to finish.
Keep it under 15 questions. Use mostly quantitative ratings (faster to answer) with one or two targeted open-ended questions. And for the love of everything, don't ask people to manually type in their department, tenure, and role. Your platform should already have that information and apply it automatically in the analysis.
One more thing: smart conditional questions. If someone rates "recognition" low, immediately ask "What type of recognition matters most to you?" That gets you 30% more useful feedback than a generic comment box at the end asking "anything else to add?"
Annual engagement surveys are performative. HR launches them, executives review company-wide scores, maybe there's a town hall where leadership says "we hear you and we're working on it," and then... nothing changes for another 12 months.
Why? Because employee engagement isn't static. The person who was thriving in Q1 might be burned out by Q3 after a brutal project deadline. The team that had great scores in March might have a new manager in August who's driving everyone away. Annual measurement can't catch any of this.
Track employee engagement monthly or quarterly. Yes, it's more work. But it's the only way to spot declining motivation before it becomes turnover. If you wait a full year between measurements, you're not measuring engagement in an actionable way.
Most companies fail at execution, not survey design. They finally get a good 10-question survey, launch it quarterly, and then completely botch everything that happens next. Here's what you actually need to succeed.
Low response rates kill engagement measurement. If only 45% of employees respond, you're not measuring engagement, but rather who has strong feelings (very engaged or very disengaged). The quiet majority in the middle, the people actually at risk of leaving, didn't bother answering.
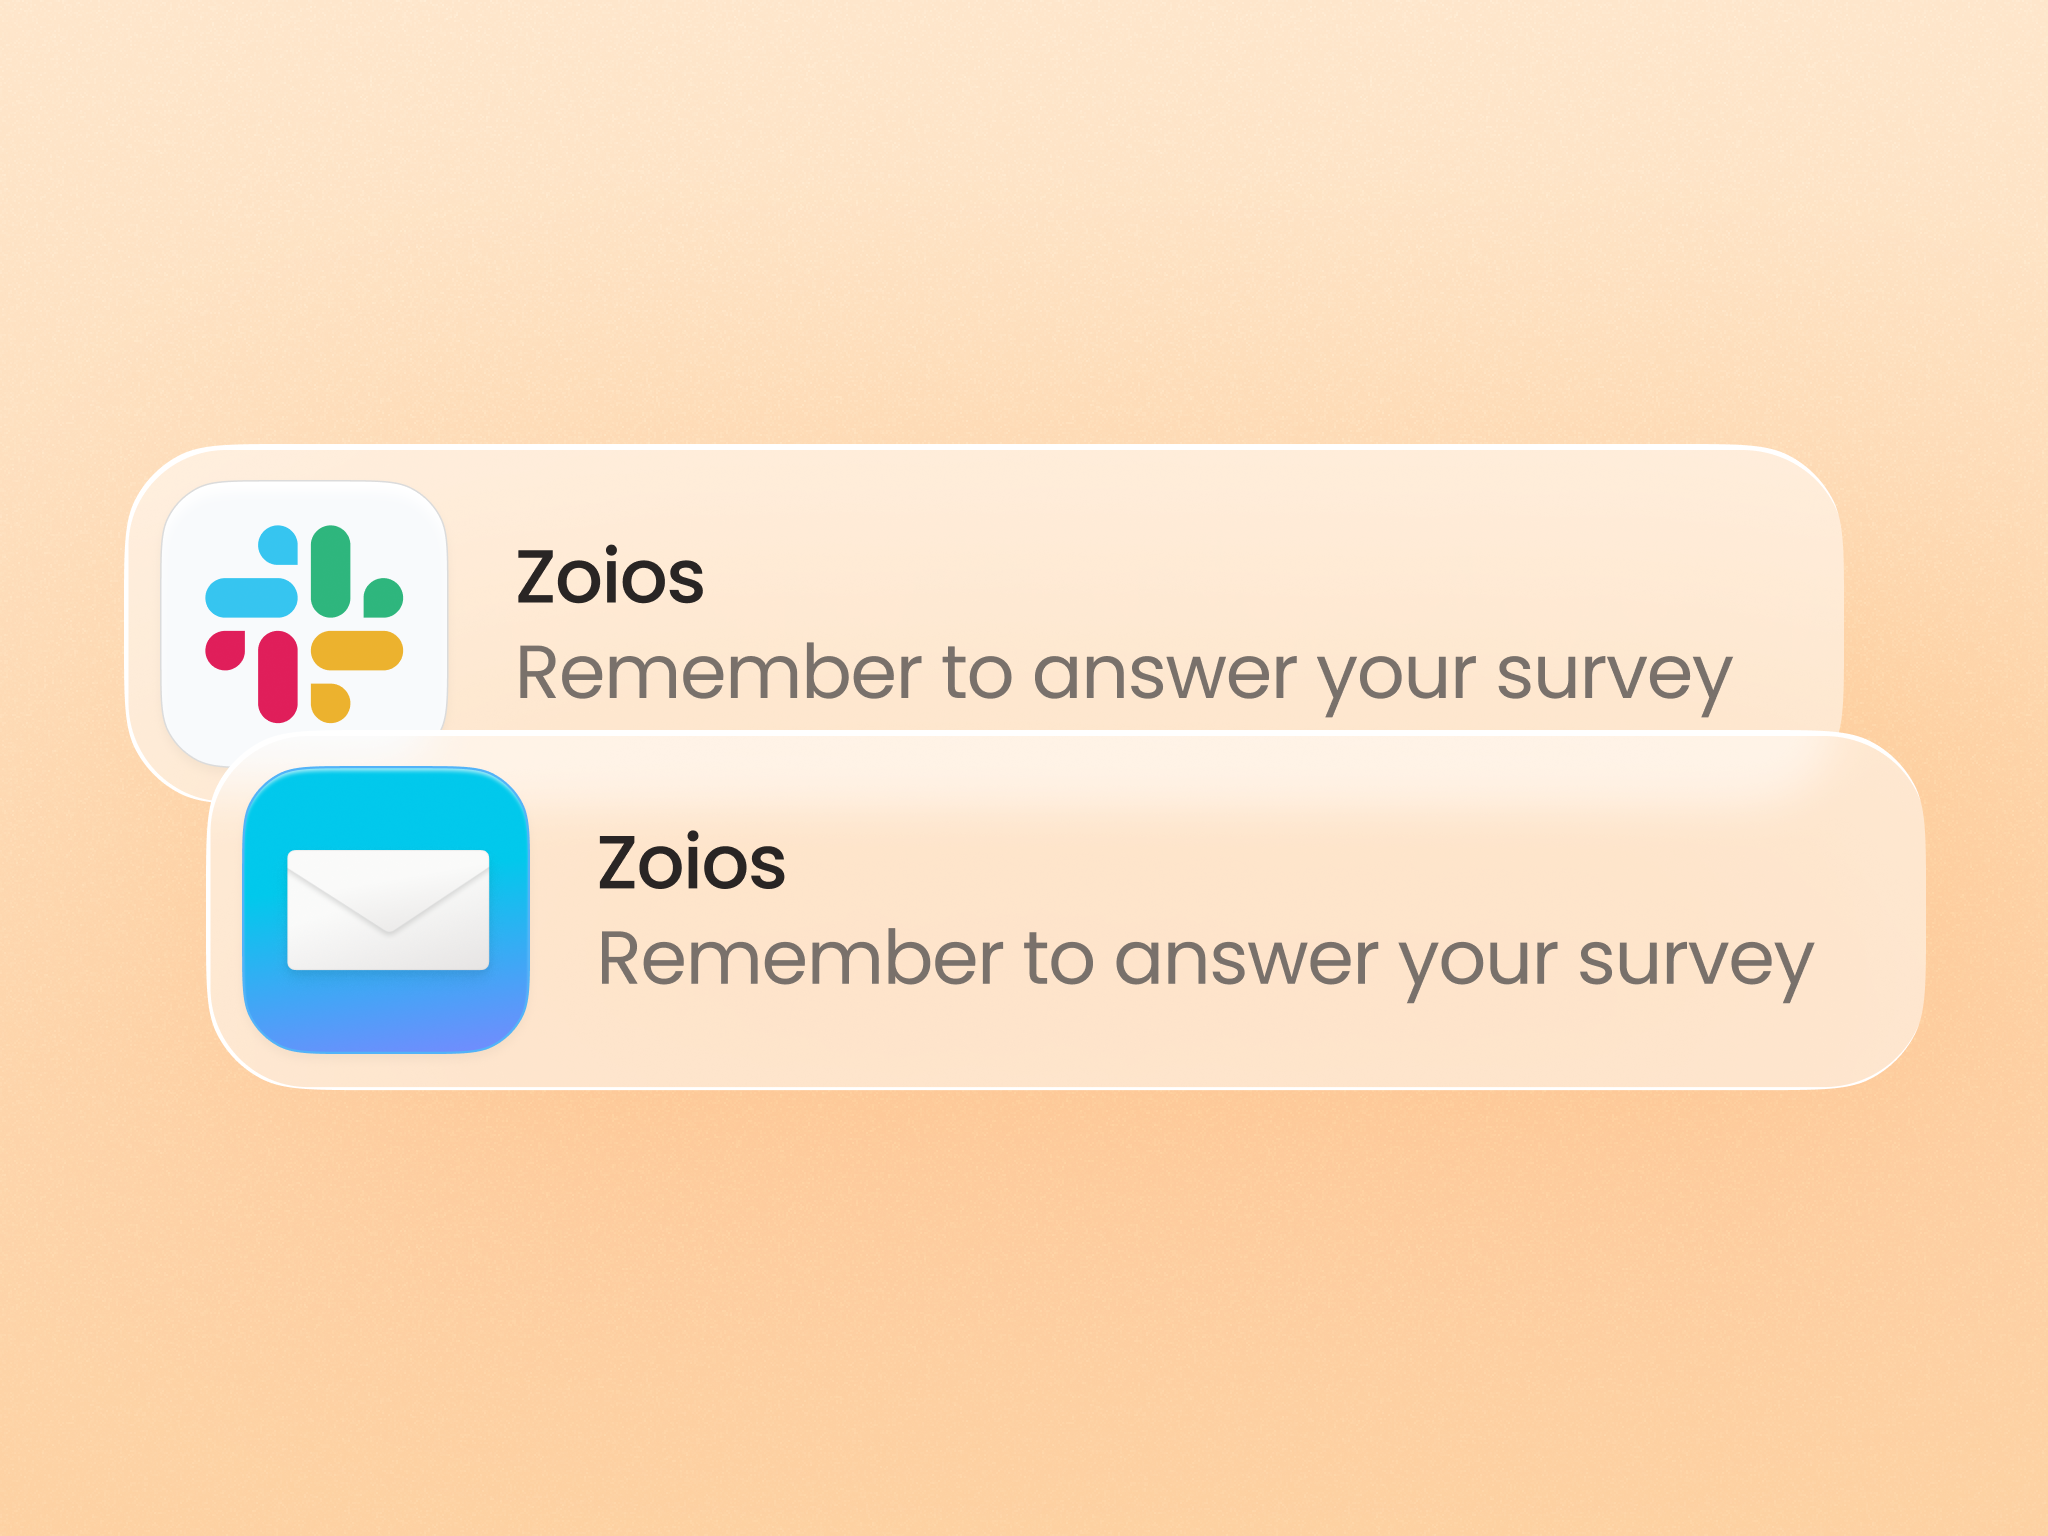
Here's the unglamorous truth: you have to send reminders. Multiple reminders. Our data shows each reminder gets roughly 50% of remaining non-responders to answer. First reminder: 50% of holdouts respond. Second: 25% more. Third: 13% more. That's how you get from 50% to 90%.
Use tools that automate this and only remind people who haven't responded yet. Send reminders via both email and Slack (engineers especially live in Slack, not email). Make the survey accessible on mobile. Remove every possible friction point.
Employee engagement data has a shelf life. If managers get their team reports 6 weeks after the survey closed, they're looking at old news. The stressed team member who scored low? They've already resigned. The project causing burnout? It finished three weeks ago.
Aim for reports to be ready within 1-2 days of the survey closing. Keep the survey window short (we recommend 1-2 week) so results represent a consistent snapshot, not a month-long rolling average of changing sentiment.
Modern software with real-time analytics makes this possible. As responses come in, dashboards update automatically. No waiting for someone to manually compile spreadsheets or build PowerPoint decks. The data should be accessible the moment the survey closes.
Most managers stare at engagement scores and think "okay, my team scored 67 on motivation and 72 on recognition... now what?" They're busy running projects, hitting deadlines, and managing daily operations. They don't have time to become amateur organizational psychologists.
Convert data into action. Show them: "Your team's engagement dropped because workload and role clarity both declined. Here are three specific things to address this: 1) Review project allocations in your next team meeting. 2) Have 1:1s focused on priority clarification. 3) Discuss realistic timelines for current commitments."
AI-powered platforms can do this automatically for every team. If you're building this manually, assign an HR partner to sit with each manager and translate scores into specific, concrete actions they can take this week.
Getting started with Zoios is easy and you can trial our pro plan for free. You can also continue to measure employee satisfaction for free on our starter plan.
Import all your employees from an Excel or CSV file. We'll help you do this free of charge within a day to avoid technical issues.
If you have an HR-IS system we can also set up an integration that automatically syncs employee information from your HR system to the Zoios platform.
Add any segmentation that you might want like gender, generation or level.
Make sure your managers are aware that you're introducing this system to get an overview of the organization and be more proactive on employee trends, not to monitor their individual performance.
Communicate it at an all-hands or town hall meeting. Let employees know you'll start measuring more actively and need their input. We have a presentation template you can use that covers anonymity practices, timing and what to expect.
To run your survey you decide what day you want it to be sent, and then Zoios manages all the sending and follow-ups with employees automatically.
If you use Slack then add that integration in just four clicks before the date of your survey.
The system automatically enforces anonymity, so results from any groups that are too small will not be visible.
The data is instantly available and converted into intuitive reports with benchmarks and deep analyses across the entire organization.
You then give your managers access to their departments and teams, and the platform will serve them detailed reports, root cause analyses and concrete actionable recommendations to improve their leadership and the eNPS, well-being, satisfaction and stress levels in their team.
Zoios is anonymous for employees, and SOC-2 TYPE II certified.